


Is the Labor Market as Tight as It Seems?
The labor market is said to be “tight” if vacant jobs are plentiful and available workers are scarce. It is said to be “loose” if the opposite holds true. Gauging the degree of labor market tightness or looseness requires measures of vacancies and available workers. The Job Openings and Labor Turnover Survey (JOLTS) provides a measure of vacancies (V). But how to measure the available workforce?
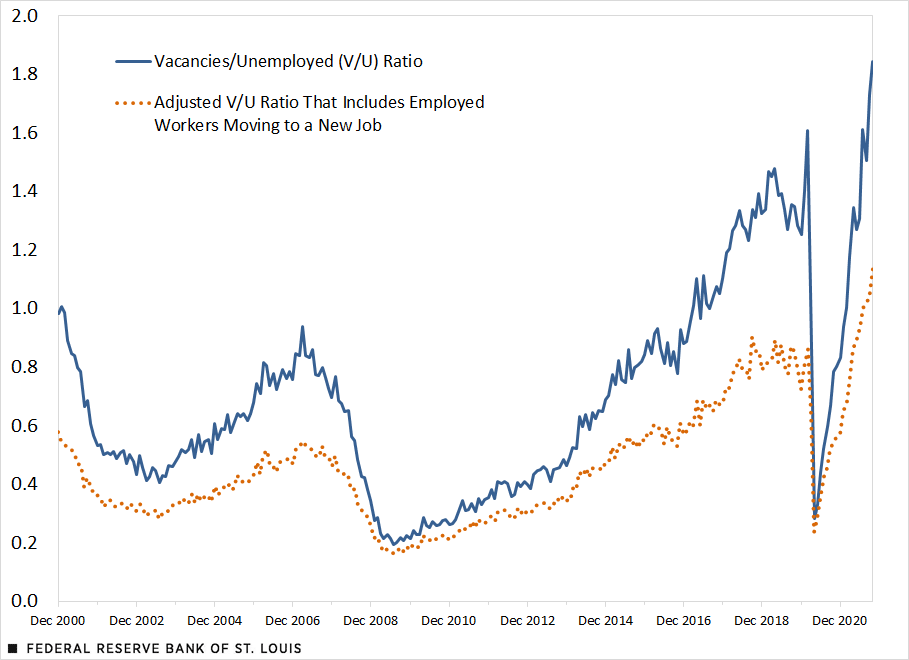
Traditionally, economists have used the number of unemployed (U) workers. The justification for this is that the unemployed are, by definition, not working but engaged in an active job search. In this way, we can construct what is now considered the conventional measure of labor market tightness, the V/U ratio.
Labor Market Appears Tight
In the U.S., the V/U ratio was over 1.8 in the last quarter of 2021, which meant that there were nearly two vacancies for every unemployed worker. This was higher than its pre-pandemic level and higher than the recent historical norm of about 0.7 since 2000. Everyone seems to agree that the labor market is very tight.
But if the labor market is so tight, why are real wages not rising more rapidly? In fact, given recent inflation, real wages for many workers appear to be declining. At the same time, profit margins appear elevated. How is this consistent with a tight labor market?
There may be several reasons behind this phenomenon. For example, there is some anecdotal evidence suggesting that workers in the post-pandemic world are receiving higher compensation through nonpecuniary benefits, like more flexible work schedules.
Another possibility is that the conventional measure of available workers—the number of unemployed—is inadequate. In particular, many workers do not become unemployed before finding a new job. Instead, they make job-to-job transitions. To the extent that employed workers are competing for the available set of job vacancies, the labor market may be considerably less tight than what is implied by the V/U ratio. Indeed, we found this to be case.
Accounting for Employed Job Seekers
In the figure below, we plotted the conventional measure of labor market tightness, V/U (the blue line). We also plot an adjusted measure of labor market tightness, V/(U + E*J2J) (the dotted orange line). This adjusted measure includes a different calculation for available workers, U + E*J2J, in which E measures the level of employed workers and J2J measures the job-to-job transition rate in a given month; we calculated the transition rate from the Current Population Survey (CPS).
Measuring Labor Market Tightness
SOURCES: JOLTS, Current Population Survey and authors’ calculations.
NOTES: That data are through October 2021. The blue line plots the vacancies (V)-to-unemployed (U) ratio. The dotted orange line plots vacancies to a broader measure of job searchers that includes all unemployed and all employed (E) who make a job-to-job (J2J) transition in a given month. In both cases, the larger the ratio, the tighter the labor market.
The idea is that E*J2J captures availability of employed workers as reflected by actual job-to-job transitions relative to the stock of employed workers. According to our adjusted measure, job vacancies relative to available workers is closer to parity. This ratio is considerably lower than the conventional measure, although it is still elevated compared with its historical average.
Tight Labor Markets and Wage Growth
It is not entirely clear how this adjustment to measuring labor market tightness can be reconciled with what appears to be relatively sluggish real wage growth. While our adjusted measure suggests the labor market is not as tight as the conventional measure indicates (hence the possibility of weaker real wage growth), it is also true that real wage gains tend to be realized among those making job-to-job transitions. Thus, it matters whether the labor market loosens because unemployment increases or because the employed suddenly become more mobile: Real wages may fall in the former case and rise in the latter.
The basic lesson here is that interpreting measures of labor market tightness and what they may imply for real wages should be undertaken with care.


Citation
David Andolfatto and Serdar Birinci, ldquoIs the Labor Market as Tight as It Seems?,rdquo St. Louis Fed On the Economy, June 21, 2022.
This blog offers commentary, analysis and data from our economists and experts. Views expressed are not necessarily those of the St. Louis Fed or Federal Reserve System.
Email Us
All other blog-related questions