


The Great Resignation vs. the Great Reallocation Revisited
The Great Resignation—a term referring to the historically high levels of voluntary job separations during the economic recovery of 2021—continues to garner interest among journalists and social analysts. In a previous Economic Synopses essay, Serdar Birinci and Aaron Amburgey examined the Great Resignation hypothesis at the industry level. In this blog post, we continue this examination by looking at quits and job-to-job transitions across four broadly defined occupation groups.
For each group, we consider the total number of quits and two components: quits to unemployment and job-to-job transitions (or quits to other jobs). We show that, for all occupation groups, quits are mostly driven by job-to-job transitions—indicative of what we call the Great Reallocation—rather than quits to unemployment, as the term the Great Resignation may suggest. Meanwhile, job-to-job transitions, and thereby total quits, increased the most in the type of occupations that are typically found in the service sector.
Defining Occupation Groups
Data for our analysis come from the Current Population Survey, which tracks employment status, occupation, change of employer and reason for unemployment of U.S. workers on a monthly basis.
Our focus is 2021, when quit rates climbed above pre-pandemic levels. In January 2020, the quit rate for workers excluding farm laborers was 2.4%. By April, it had plummeted to 1.6%, but quickly rebounded and returned to its pre-pandemic level by the end of 2020. Throughout 2021, the quit rate continued its upward trend, reaching 3% in December. See this FRED figure of the U.S. quit rate. We broke down occupations into four groups along two dimensions: whether an occupation is manual or cognitive and whether it is routine or nonroutine.We used the methodology found in Autor, David H.; and Dorn, David. “The Growth of Low-Skill Service Jobs and the Polarization of the U.S. Labor Market.” American Economic Review, August 2013, Vol. 103, No. 5, pp. 1553–97.
Occupations are considered manual if they involve more physical activities and cognitive if they involve more mental tasks. Occupations are considered routine if the tasks involved can be accomplished by following a set of well-defined procedures and nonroutine if these tasks require more complex problem-solving and communication skills. Below are examples of occupations in each group:
- Nonroutine cognitive: managers, doctors, engineers, etc.
- Nonroutine manual: child care workers, janitors, food service workers, etc.
- Routine cognitive: cashiers, sales agents, postal service workers, etc.
- Routine manual: construction laborers, electricians, flight attendants, etc.
Job-to-Job Transitions and Quits to Unemployment by Occupation Groups
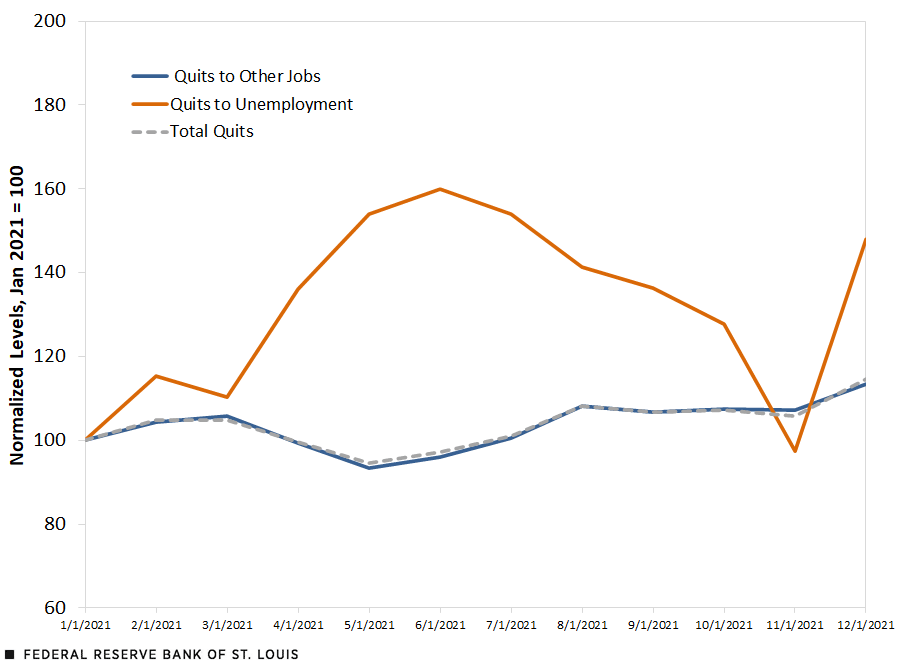
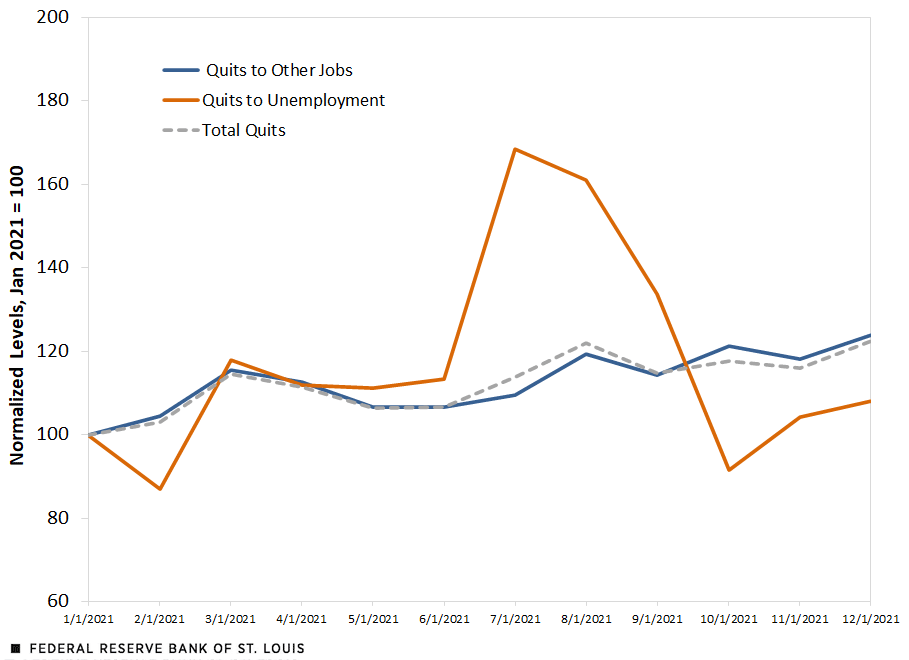
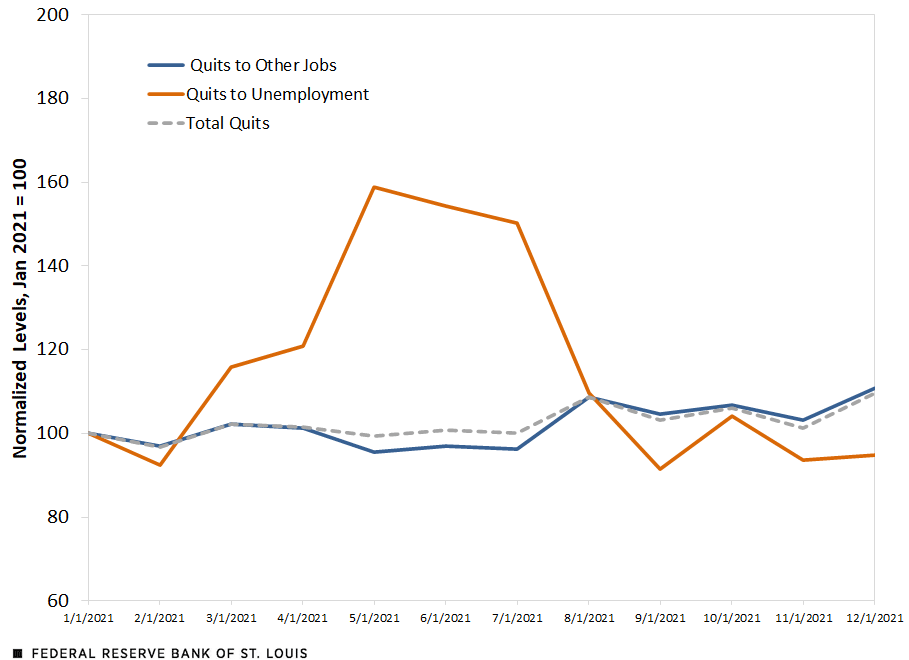
The next four figures plot the normalized (January 2021 = 100) number of total quits (gray dashed lines), quits to unemployment (orange lines) and job-to-job transitions (blue lines) for nonroutine cognitive, nonroutine manual, routine cognitive and routine manual occupations, respectively.
Quits for Nonroutine Cognitive Occupations
Quits for Nonroutine Manual Occupations
Quits for Routine Cognitive Occupations
Quits for Routine Manual Occupations
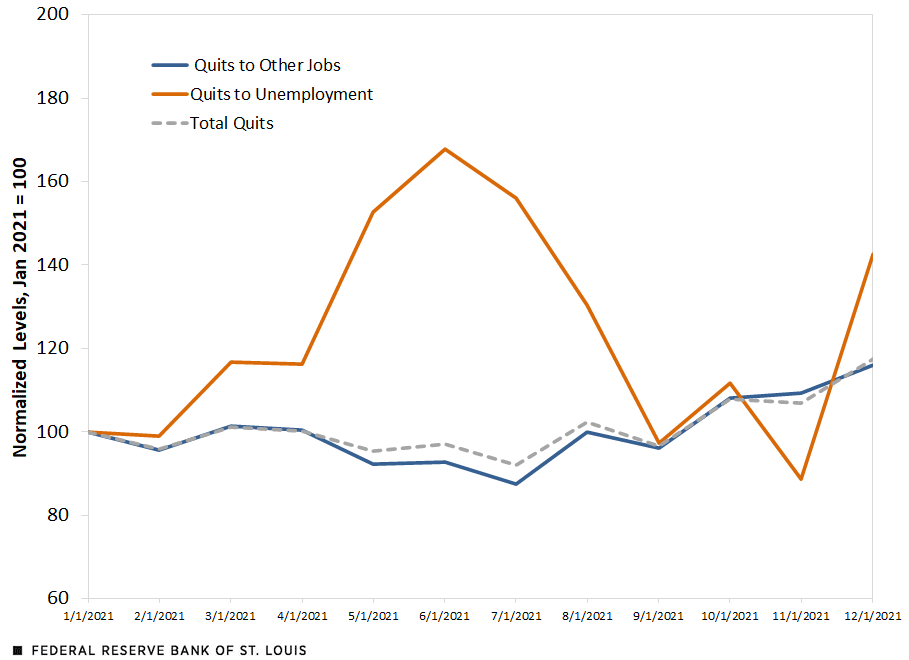
SOURCES FOR THE FOUR FIGURES: Current Population Survey and authors’ calculations.
NOTE FOR THE FOUR FIGURES: Data are seasonally adjusted and smoothed with a three-month moving average.
We found that total quits in nonroutine manual occupations experienced the sharpest rise during 2021, while the growth in quits was more modest in other occupation groups. We also showed that across occupation groups, movements in the number of job-to-job transitions very closely track movements in the total number of quits, indicating that job-to-job transitions are the main driver behind changes in total quits. As a result, this trend is more indicative of labor market reallocations, i.e., the Great Reallocation, rather than quits to unemployment, as the term the Great Resignation may suggest.
Focusing on job-to-job transitions, all occupation groups except nonroutine manual did not see sizable increases until December 2021. Between January 2021 and November 2021, job-to-job transitions increased by only about 7% for nonroutine cognitive occupations, about 3% for routine cognitive occupations and about 9% for routine manual occupations. December, however, saw jumps in the number of job-to-job transitions for all three groups, with increases from January 2021 of approximately 14%, 11% and 16%, respectively.
On the other hand, in nonroutine manual occupations, job-to-job transitions were on a steady and significant increase throughout 2021. Job-to-job transitions grew by about 18% between January 2021 and November 2021 for this group—approximately twice the corresponding increase for its routine counterpart. By December, they had grown by almost 24% compared with January 2021.
Conclusion
In 2021, the Great Resignation narrative gained traction in the discourse on how COVID-19 permanently changed workers’ relationship to work. Following a voluntary separation, a worker can flow into either unemployment or employment with another employer. A careful consideration of this movement reveals that the latter—that is, job-to-job transitions—drives most of the change in the total number of quits during 2021. The so-called Great Resignation may therefore be more appropriately dubbed the Great Reallocation, as quits largely don’t reflect a desire to stop working altogether, but to find new (and presumably better) employment.
Consistent with our previous work using industry-level evidence, the most sizable increase in job-to-job transitions comes from nonroutine manual occupations, of which service industry jobs make up a large proportion. Job-to-job transitions, in turn, typically lead to higher wage growth, as we discussed in a previous blog post on job-switching rates during the COVID-19 recession. Taken together, these two pieces of empirical evidence are consistent with another empirical observation that recent average wage increases have been relatively high for workers in the service industry.
Notes and References
1 In January 2020, the quit rate for workers excluding farm laborers was 2.4%. By April, it had plummeted to 1.6%, but quickly rebounded and returned to its pre-pandemic level by the end of 2020. Throughout 2021, the quit rate continued its upward trend, reaching 3% in December. See this FRED figure of the U.S. quit rate.
2 We used the methodology found in Autor, David H.; and Dorn, David. “The Growth of Low-Skill Service Jobs and the Polarization of the U.S. Labor Market.” American Economic Review, August 2013, Vol. 103, No. 5, pp. 1553–97.


Citation
Serdar Birinci and Trần Khánh Ngân , ldquoThe Great Resignation vs. the Great Reallocation Revisited,rdquo St. Louis Fed On the Economy, June 2, 2022.
This blog offers commentary, analysis and data from our economists and experts. Views expressed are not necessarily those of the St. Louis Fed or Federal Reserve System.
Email Us
All other blog-related questions