


Corporate Bond Spreads and the Pandemic
The ongoing COVID-19 pandemic has caused significant disruption in economic activity across the globe. Financial markets, in particular, have experienced surges in volatility that had not been seen since the 2007-09 financial crisis.
Policymakers have responded by deploying a variety of measures aimed at stabilizing these markets and preventing the real disruption from causing a full-blown financial crisis. The Federal Reserve, in particular, has returned to its financial crisis toolkit by creating facilities to purchase asset-backed securities (such as mortgage-backed securities) and other types of securities (such as corporate debt).
In this blog post, we look at the effects of the ongoing pandemic and some of the policy responses on the corporate bond market.
The figure below plots the median value for our measure of credit spreads (the difference between a corporate bond’s yield and a benchmark interest rate on U.S. government securities) at the daily frequency, since the beginning of the year.We compute credit spreads by taking information on prices at which bonds are traded from TRACE (FINRA) and combining it with information on bond-level characteristics from Mergent FISD. This follows the methodology used in Gilchrist, Simon; and Zakrajsek, Egon. “Credit Spreads and Business Cycle Fluctuations.” American Economic Review, June 2012, Vol. 102, No. 4, pp. 1692-720. See the appendix at the end of this post for a less technical explanation of corporate bonds and credit spreads.
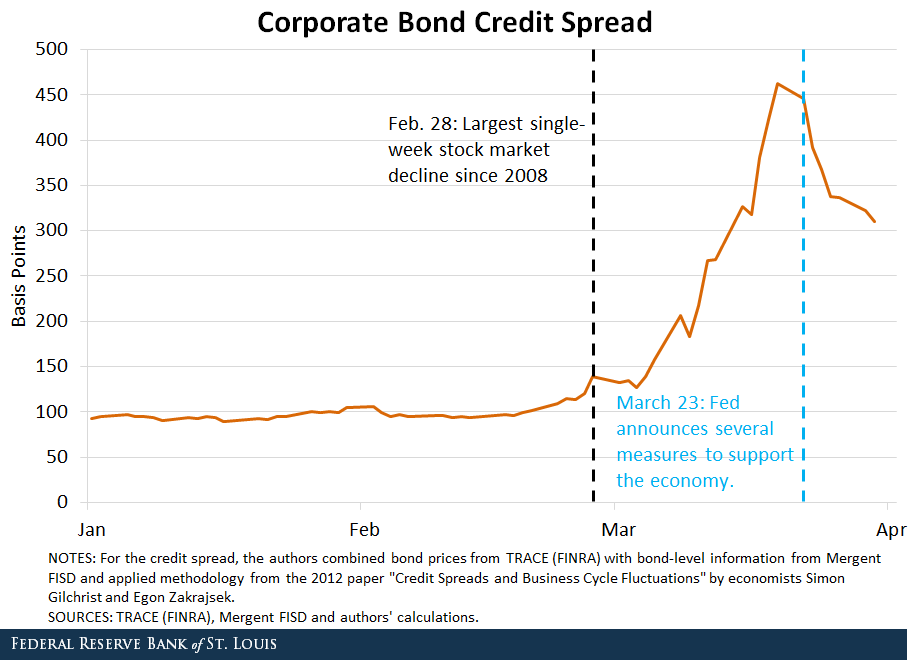
The figure highlights two important dates. The first one is Feb. 28, when stock markets experienced the largest single week declines since the 2008 financial crisis.FRASER has a timeline of the events for the COVID-19 Pandemic While the median spread had been stable at around 100 basis points since the beginning of the year, it started rising around this date, as financial market turmoil became more evident.
The second line corresponds to March 23, the day when the Fed announced a series of new measures to support the economy. Most notably, the Fed announced a series of programs that helped borrowing conditions for firms:
- It directed the Open Market Desk to purchase commercial mortgage-backed securities.
- It established a Primary Market Corporate Credit Facility to purchase new bond and loan issuances.
- It established a Secondary Market Corporate Credit Facility to purchase outstanding corporate bonds.
- It expanded the Commercial Paper Funding Facility, which purchases very short-term corporate debt.
The figure above suggests that these measures were very effective at containing the rise of borrowing costs for firms.
Volatility in Bond Markets
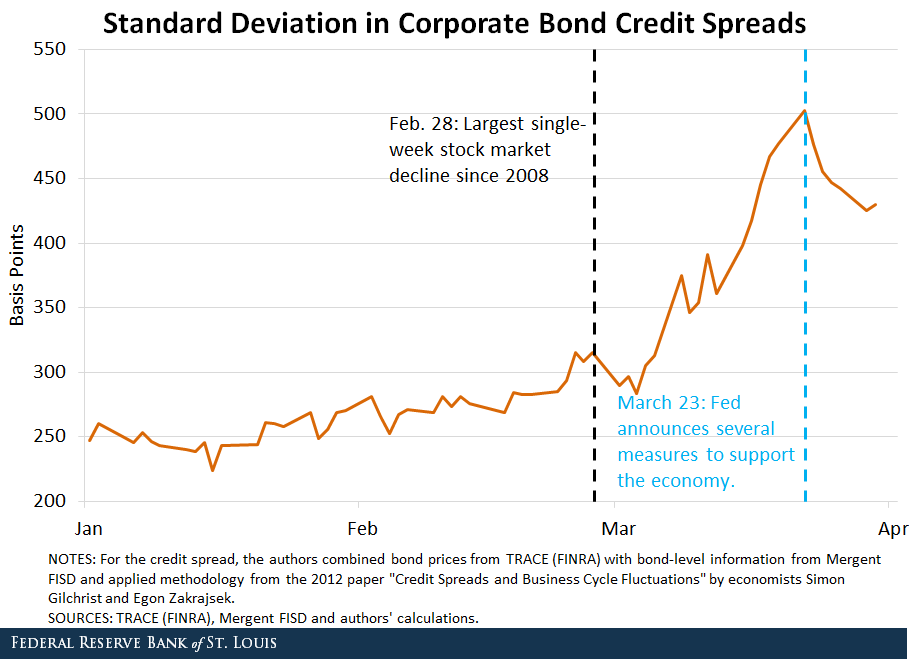
The figure above shows the median behavior of borrowing costs, but it hides a substantial amount of heterogeneity in the bond market. In practice, the borrowing costs of some firms went up by a lot, while the costs for other firms may not have increased by as much.
To shed light on this heterogeneity, the figure below plots the cross-sectional standard deviation of our credit spread measure. This is useful to tell us how much variation across bonds there is. This figure shows us a similar pattern to that of the previous figure: Dispersion in the bond market rose substantially throughout March and halted with the Fed’s March 23 announcements.
Heterogeneous Dynamics of Credit Spreads across Credit Ratings
The figures below plot the median and standard deviation of credit spreads for three groups of bonds:
- Those with high ratings (A- and above)
- Those with medium ratings (between BBB and BB-)
- Those with low ratings (B+ and below, including unrated)
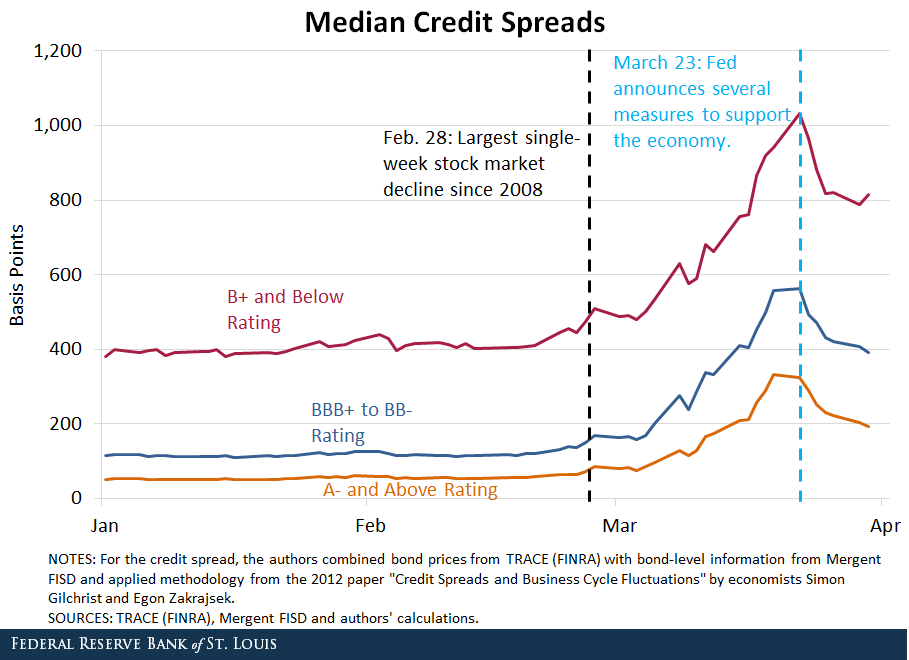
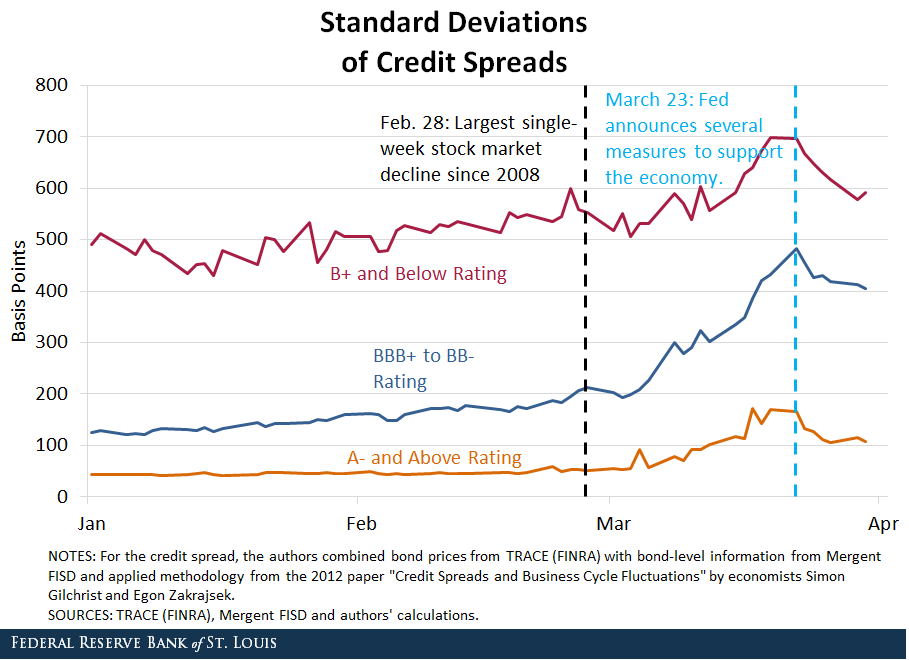
These figures show that the increase and subsequent decrease of the median and standard deviation of credit spreads happened for all credit ratings. Interestingly, the increase in the median spread was more pronounced for firms with low credit ratings (B+ and below), while the increase in dispersion is larger for firms in the middle group (BBB+ to BB-).
One potential explanation is that firms with low credit ratings are all affected by an aggregate factor, so the dispersion across firms does not change much. On the other hand, firms in the middle category may have heterogeneous exposures to the ongoing economic disruption, which generates a larger increase in the cross-sectional dispersion.
In subsequent blog posts, we will continue to explore the dynamics of bond markets during the ongoing COVID-19 pandemic, focusing on the behavior of borrowing costs across sectors and the effects of Fed policy in these markets.
Notes and References
1 We compute credit spreads by taking information on prices at which bonds are traded from TRACE (FINRA) and combining it with information on bond-level characteristics from Mergent FISD. This follows the methodology used in Gilchrist, Simon; and Zakrajsek, Egon. “Credit Spreads and Business Cycle Fluctuations.” American Economic Review, June 2012, Vol. 102, No. 4, pp. 1692-720. See the appendix at the end of this post for a less technical explanation of corporate bonds and credit spreads.
2 FRASER has a timeline of the events for the COVID-19 Pandemic.
Additional Resources
- St. Louis Fed’s COVID-19 resource page
- On the Economy: The St. Louis Fed’s Financial Stress Index, Version 2.0
- On the Economy: COVID-19: Forecasting with Slow and Fast Data
Appendix
Corporate Bonds: Firms finance their activities in many different ways. One of the most important is by issuing debt, or borrowing. Most borrowing is done from a single lender (a bank loan), a group of lenders (a so-called syndicated loan) or from financial markets. Firms borrow from financial market participants by issuing bonds. The yield (or interest rate) at which those bonds are issued (and traded) is a direct measure of how expensive it is for the firm to borrow. If it becomes too expensive for a firm to borrow, that firm may invest less, create less jobs or even be forced to reduce its number of workers. The yield at which a firm’s bonds trade—that is, the cost of borrowing for that firm—is therefore very important for a firm’s performance and ability to hire and retain new workers.
Bond Prices and Credit Spreads: Corporate bond yields reflect many different factors, the most important being:
- Credit risk, or the probability that the firm won’t be able to repay the loan
- Term premium, or the fact that longer-term loans are more expensive than shorter-term ones
- General financial market conditions, as market participants not having as many resources to lend will affect prices of all types of bonds
Rather than looking at yields, analysts typically look at credit or bond spreads, or the difference between a corporate bond’s yield and a benchmark interest rate on government securities. The yield by itself is uninformative, as it will tend to comove with the general level of interest rates. It is therefore more useful to compare the cost of borrowing of a given firm to the cost of borrowing of a very safe entity, such as the government.
One measurement challenge is finding the “right” government security to compare a given bond to, as there may be no government securities with the exact same maturity and interest payment schedule as a bond issued by a given firm. In our analysis, we applied the methodology of economists Simon Gilchrist and Egon Zakrajsek in their paper “Credit Spreads and Business Cycle Fluctuations” and computed corporate bond spreads that take these factors into account. This means that our resulting measure reflects only firm-specific credit risk and general financial market conditions.


Citation
Miguel Faria-e-Castro, Julian Kozlowski and Mahdi Ebsim, ldquoCorporate Bond Spreads and the Pandemic,rdquo St. Louis Fed On the Economy, April 9, 2020.
This blog offers commentary, analysis and data from our economists and experts. Views expressed are not necessarily those of the St. Louis Fed or Federal Reserve System.
Email Us
All other blog-related questions