


COVID-19’s Effects on Dual-Earner Households

It is no secret that the COVID-19 crisis has had negative effects on the labor market. In our previous article “Which Earnings Groups Have Been Most Affected by the COVID-19 Crisis?” we compared the employment outcomes of various earnings groups and concluded that individuals in lower-earning occupations were disproportionally affected in the initial stages of the pandemic.
In this post, we analyze the impacts of the crisis on families at various earnings levels, because the negative effects of an individual job loss can be blunted by a spouse’s earned income.
We used data from the Current Population Survey (CPS) and focused on families of married couples in which each spouse was in the labor force. Ignoring any other working individuals in the households (e.g., adult children) we refer to these families as two-earner households. In our sample from 2020-21, two-earner households made up 49% to 52% of married-couple families, varying only slightly over time.
To split households into earnings groups, we first grouped occupations into quintiles based on the average annual earnings of individuals.Examples of occupations in each quintile are listed in Table 1 of our previous article. We then identified the primary earner of each household based on employment status, occupation and working hours. Finally, we assigned households into occupational earnings quintiles based on the occupations of their primary earners.
Effects on Unemployed Earners
The first figure plots the percentage of all two-earner households in which both individuals were unemployed. Prior to the COVID-19 crisis, the aggregate fraction of households with both individuals being unemployed was less than 1% among all households.
This fraction increased by about 2.5 percentage points to 3% before slowly decreasing below 1% by August 2020. Households in the third, fourth and fifth occupational earnings quintiles (Q3, Q4 and Q5) faced similar patterns to the aggregate.

However, households in the first and second quintiles (Q1 and Q2) both saw 7 percentage point increases in dual unemployment from March to April 2020, reaching approximately 8.5%. They faced slower recoveries as well, with both workers unemployed in 2% of these households by February 2021, which was still more than 1 percentage point higher than pre-pandemic rates.
This disproportionally large increase in the unemployment of lower-earning households is particularly concerning, considering they had less savings to fall back on.
Effects on Employed Earners
While dual unemployment slowly neared pre-pandemic rates in low-earnings quintiles, the same cannot be said for dual employment rates. The second figure plots the percentage of households in which both individuals were employed.
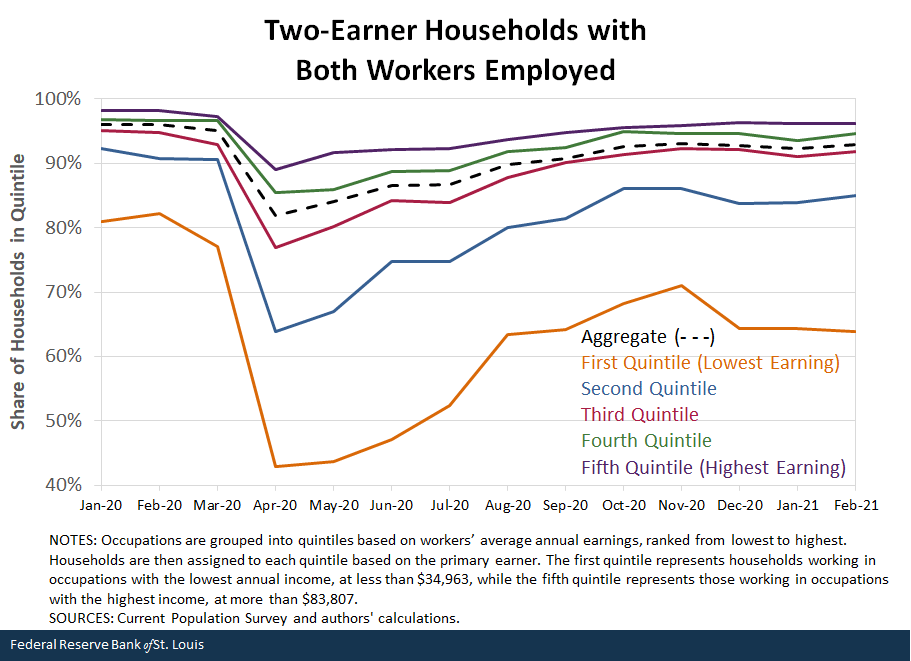
Notably, the pre-pandemic rate was approximately 96% for all households, with just 82% of Q1 households experiencing dual employment. The aggregate rate of dual employment fell 14 percentage points, from 96% to 82%, from February to April 2020, before slowly recovering to 93% by February 2021.
This decrease was much larger for Q1 and Q2, dropping 39 percentage points to 43% and 27 percentage points to 64%, respectively. After the initial shock around April 2020, these rates slowly increased before stagnating in recent months.
In February 2021, the dual employment rate of Q1 households stood at 64%, 18 percentage points lower than before the pandemic. The stagnating employment of secondary earners in low-earning households is confounding—and troubling.
To investigate this result further, we repeated our original exercise, incorporating one-earner and two-earner households. When these two types of households are aggregated, the percentage of households with two nonworking spouses had also stagnated for Q1 and Q2 households. However, the dual unemployment rate for the combined households was also much higher than the dual unemployment rate for the two-earner households. In the case of Q1 households, the gaps between the pre-pandemic rate and the February 2021 rate were 4 percentage points for the combined households and 1 percentage point for the two-earner household.
The diverging rates suggest that in many low-earning households, the secondary earner dropped out of the labor force, creating downward pressure on the rate of dual unemployment as these households exited our sample.
Harsher Crisis for Low-Income Households
The initial effects of the pandemic hit households throughout the U.S., regardless of earnings group. However, these effects were strongest for households in lower earnings groups, with those in the lowest two quintiles (Q1 and Q2) experiencing much greater increases in dual unemployment.
In recent months, both spouses were employed in the vast majority of two-earner households, except Q1 households in which the dual-employment rate was only 64% by February 2021. Furthermore, when we considered one- and two-earner households, we found that many secondary earners in low-earning households had dropped out of the labor force.
While the extension of unemployment insurance benefits and fiscal transfers are useful in dampening the negative effects of the COVID-19 crisis on households, the employment losses in low-income households seem to be persistent.
Notes and References
- Examples of occupations in each quintile are listed in Table 1 of our previous article.
Additional Resources
- On the Economy: Are We Really in This Together? The Divided Nature of the COVID-19 Pandemic
- On the Economy: Labor Market Engagement and the Pandemic’s Impact on American Workers
- Regional Economist: Women Affected Most by COVID-19 Disruptions in the Labor Market


Citation
Serdar Birinci and Aaron Amburgey, ldquoCOVID-19’s Effects on Dual-Earner Households ,rdquo St. Louis Fed On the Economy, May 4, 2021.
This blog offers commentary, analysis and data from our economists and experts. Views expressed are not necessarily those of the St. Louis Fed or Federal Reserve System.
Email Us
All other blog-related questions