


Three Economic Indicators That May Regain Focus in Policy Debate and Outlook
With the U.S. unemployment rate on track to return to prerecession levels and inflation low and stable, other economic indicators are likely to regain focus in the policy debate and outlook.
Output
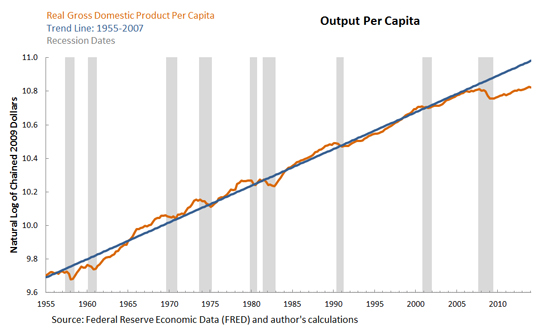
The first chart shows real gross domestic product divided by total population (or output per capita) since 1955. When output per capita is expressed in natural logarithms, it exhibits a linear trend, which implies that it grows at a constant rate in the long run.1
A striking feature of the most recent recession is the sharp and persistent contraction in economic activity. Output per capita took about five and a half years to come back to its precrisis level and, as of the first quarter of 2014, is about 15 percent below its precrisis trend. In addition, the growth rate appears to have dropped significantly. Between 1955 and 2007, output per capita grew by 2.2 percent annually on average. After contracting at an average annual rate of 2.5 percent between 2008 and 2009, growth resumed at a more moderate pace of 1.6 percent annually since 2010.
Consumption
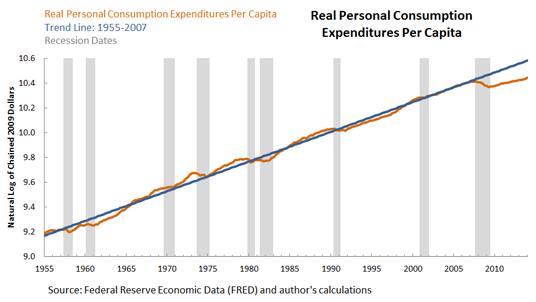
The second chart shows real personal consumption expenditures per capita. Consumption is highly correlated with output, but typically less volatile. During the last recession, consumption per capita also contracted sharply and subsequently resumed growth at a more modest pace. The figures for consumption are very similar to those cited for output above.
Investment
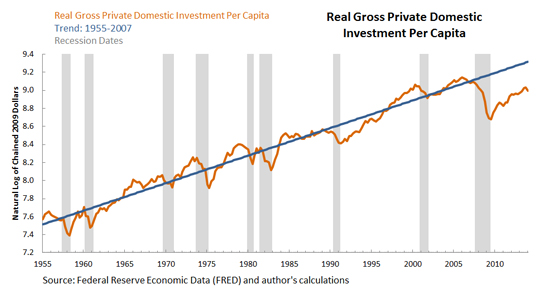
The third chart shows real gross private domestic investment per capita. Investment is also highly correlated with output (although much more volatile), and it contracted significantly during the last recession. As opposed to output and consumption, investment per capita has been growing above its precrisis growth rate since the end of the recession. However, it has not yet fully recovered and remains 27 percent below trend.
The evolution of output, consumption and investment contrasts with the ongoing improvement in labor market conditions and the stability of inflation. This leaves open the question of what types of policies will be favored in the near future. Will policymakers interpret the persistent contraction in economic activity and drop in growth as evidence that the economy still has not recovered and is below its potential? Or will they interpret this behavior as a permanent effect of the crisis, which government policy alone may not be able to overturn?
Notes and References
1 Macroeconomic variables that exhibit exponential growth, such as output and consumption, are frequently expressed in natural logarithms to transform them into series with a linear trend. The difference between the logged series and its linear trend is approximately equal to the percent deviation of the original series from its trend.
Additional Resources
- On the Economy: Why Have Food Price Fluctuations in the U.S. and China Become More Correlated?
- On the Economy: Inequality and Growth: The Relationship Isn’t Simple
- On the Economy: Do Revisions to GDP Follow Patterns?

Citation
Fernando M. Martin, ldquoThree Economic Indicators That May Regain Focus in Policy Debate and Outlook,rdquo St. Louis Fed On the Economy, June 23, 2014.
This blog offers commentary, analysis and data from our economists and experts. Views expressed are not necessarily those of the St. Louis Fed or Federal Reserve System.
Email Us
All other blog-related questions