Home Production Activity during the COVID-19 Shutdown
KEY TAKEAWAYS
- Home production activities—including child care, cooking and other domestic concerns—increased nationwide from February to April, mainly because of pandemic-related job losses.
- The estimated monthly dollar value of home production activities during this period increased by more than $26.5 billion, or about 9.1% of the $292.6 billion drop in GDP.
- Although market hours declined the most for single, less-educated individuals, the lost market hours were absorbed into home production the most by less-educated married people with children.

The labor market effects of the economic shutdown during March, April and May have been widely discussed. Less is known about what types of families suffered the most and how they spent the extra time at home. If those extra hours were spent on home improvement projects, home schooling and cooking, the loss in market output would be partly offset by the gain in these home production activities. In this article, we estimate the effects of the pandemic on time allocation for different types of households.We analyze the issue more in-depth—for instance, by analyzing the additional effects on home production due to working from home—in our working paper, “Home Production and Leisure During COVID-19.”
The main source for time allocation is the American Time Use Survey (ATUS) from the Bureau of Labor Statistics. The ATUS is a monthly survey, but there is about a 14-month lag between data collection and their availability. Nonetheless, we can get a good sense of time allocation shifts during the pandemic by combining real-time data on work hours with the estimates of job loss effects on time use from 2003-10, a period that incorporates the Great Recession.
The effects of a job loss likely depend on the type of household experiencing it. Single workers with less education may decide to spend the extra time taking an online training class, while married workers with children may spend the extra time turning their backyards into a vacation oasis. We therefore distinguish between 20 different types of households (shown in Figure 1), differentiated by:
- Marital status (single/married)
- Gender (male/female)
- Spousal employment (working/nonworking spouse)Because of small sample sizes, we distinguish based on spousal employment only for men.
- Education (less than a bachelor’s degree/bachelor’s degree)
- Presence of children in the household (kids/no kids)
We focus on individuals of working age, from 18 to 65. We limit our analysis to February through April, since we are interested in changes from “peak to trough”—that is, from the month the current recession began (February) to the month during which many employment statistics bottomed out (April).
Home Producers, Defined
Using the latest available ATUS data,The latest available ATUS data are for 2019. we approximate that, prior to the pandemic, Americans spent 110 hours per week on sleep and leisure activities combined. They also spent 21 hours a week on home production, including about four hours on child care activities. In addition to child care, other activities that are typically classified as home production include meal preparation, laundry and cleaning, repairs, shopping and caring for other adults. Leisure activities are defined—following the work of economists Mark Aguiar, Erik Hurst and Loukas Karabarbounis—as activities for which time complements monetary expenditures.
Our first step was to estimate how much each type of household increased home production and leisure hours in response to a job loss or reduced working hours. For each type of household, we applied the 2013 methodology used by Aguilar and others of employing ATUS data for the 2003-18 period.Our working paper describes our methodology in more depth. This methodology assumes the same aggregate trend in time allocation patterns throughout the U.S., allowing us to identify any cross-state variations.Demographic controls and time dummies are included in the regression, and each observation is weighted with the state’s population. (A time dummy is a variable that equals 1 for a given year and zero for all other years. It controls for time-specific effects.) Unlike Aguiar et al., we calculated this rate of substitution separately for each household type.
Depending on the type of household considered, we found that home production activities absorb 11% to 49% of lost market hours. The smallest effect is experienced by single women with no children and no bachelor’s degree (11%). The groups that substitute lost work hours with home production the most are:
- Married women with children and no college degree (49%)
- Married women with children and a college degree (45%)
- Single men with children and no college degree (40%)
- Married men with children, a college degree and a working spouse (38%)
For most groups, the majority of lost working hours are reallocated toward sleep and leisure activities such as watching TV, socializing and exercising.Note that, in categorizing whether an activity is a “home production” or “leisure” activity, we follow the standard categories put forth by Bridgman (2016) and others in the literature.
Job Losses and Household Activities
Our second step was to calculate lost market hours during the first wave of the pandemic for each type of household. Using the Current Population Survey (CPS), we found that weekly working hours were reduced anywhere from three to 9.6 hours. Among the groups affected the most were less-educated married men with children and stay-at-home spouses (9.6 hours) and single households with kids and no bachelor’s degree (7.8 hours for men and women).
Among those least affected were college-educated men with no kids and a nonworking spouse (three hours). Applying appropriate population weights to each group, we found that, on average, weekly market hours were reduced by one hour between February and March and by another 5.2 hours between March and April, to a loss of 6.2 market hours per week.
We also found that the drop in overall working hours was mainly due to lost employment rather than reduced hours on the job. In fact, average weekly hours among the employed declined by three at most for the household groups we considered, with most groups experiencing only a one- to two-hour decline.
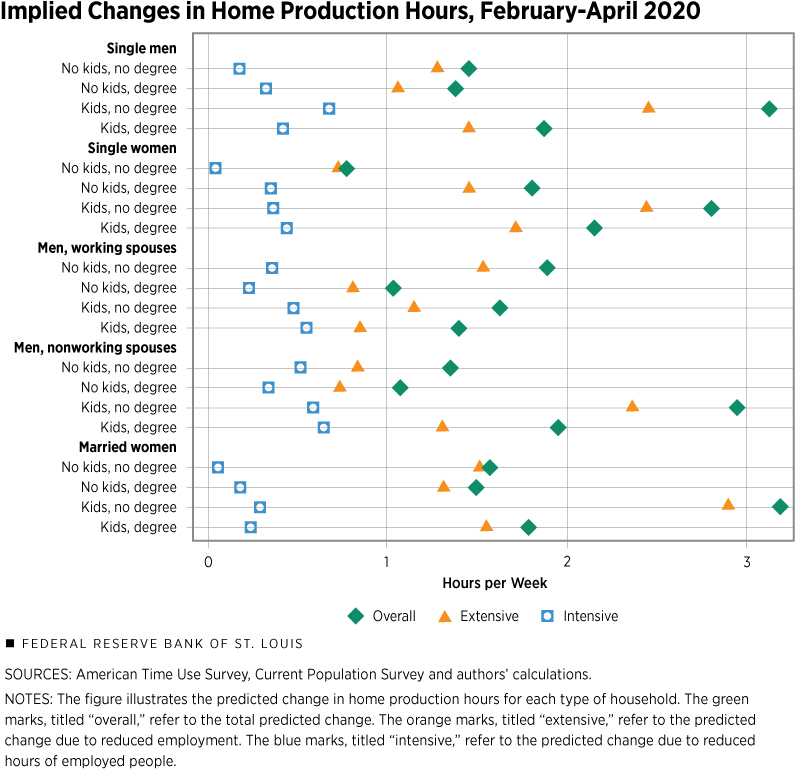
Our final step was to combine the two effects—the magnitude of the lost market hours and the rate at which those lost hours were absorbed into home production—to obtain the predicted effect of the pandemic on hours spent in home production. Figure 1 illustrates the predicted effects for each group of households.
We find the total effects, marked in green, range from 0.8 to 3.2 hours per week. The largest increase in home production hours is predicted for less-educated married women with children. This group of women had the highest ratio of home production hours to lost market hours (49%) and experienced a substantial loss of employment during the pandemic, reducing their average market hours by 6.5 a week.
The second-highest effect (a 3.1-hour-per-week increase) is predicted for less-educated single men with children. This is unsurprising, since this group of men had one of the highest ratios of home production hours to lost market hours (40%) and was the second-most affected group in terms of lost market hours (losing 7.8 hours per week on average).
Generally speaking, home production increased more for married individuals and households with children.
We also broke down the predicted change in home production hours by whether they were caused by the “intensive margin” (i.e., individuals who kept their employment but saw a change in working hours, marked in blue) or the “extensive margin” (i.e., individuals who lost their jobs altogether, marked in orange). As clearly seen from Figure 1, the intensive margin accounts for a small part of the aggregate effect, for all groups. In other words, it is the loss of employment that predominantly drives the total effect in increased home production.
Job Losses and Household Gains
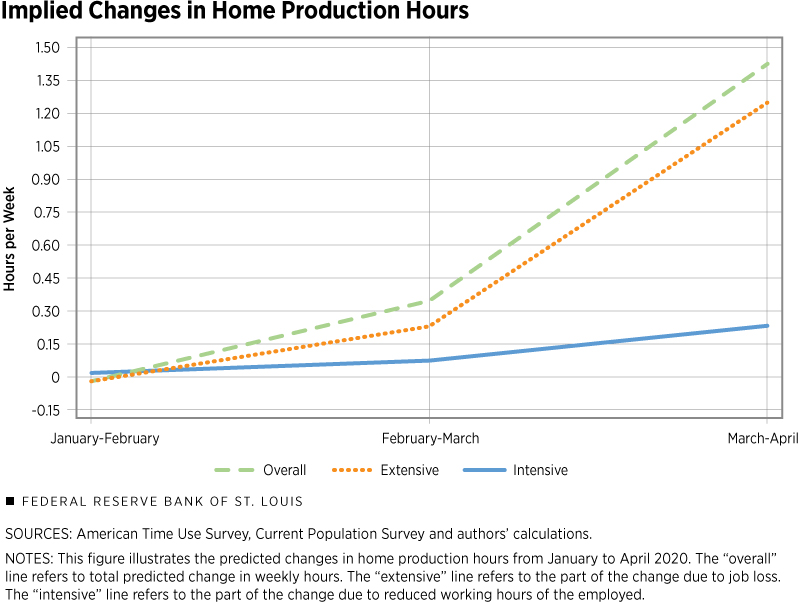
We obtained the total effects shown in Figure 2 by aggregating the group-specific effects across household groups, using each group’s appropriate population shares. Weekly home production hours (in green) did not change much between January and February, rose by 0.3 between February and March, and rose by 1.4 between March and April, totaling about a 1.7-hour increase between January and April.Here, unlike elsewhere in this article, we look at changes between January and February, just to emphasize how little aggregate home production was in flux before the recession hit.
Only 20 minutes of the 1.7 hours’ increase are accounted for by workers who maintained their employment (in blue), implying the bulk of the increase was driven by job losses. While the 1.7-hour increase in home production hours may not seem like a lot, it is almost a third of the total average 6.2-hour decline in weekly market hours. This estimate is also likely to be lower than the actual change, since options for leisure activities were limited during the economic shutdown.
To put the increase in home production hours in perspective, it is useful to estimate the gain in the value of home production. Following a methodology similar to the “specialist cost method” described in Benjamin Bridgman’s work (2016), we estimate the value of an hour of home production as the average wage among private workers employed in sectors that substitute for home production (e.g., cooks, cleaners and child care workers).See Mazzolari and Ragusa (2013) for a definition of sectors considered substitutes for home production.
Using Current Population Survey data, we found that such workers earn $17.35 an hour on average.We specifically use January 2020 CPS data to account for the possibility that wages in later months may have been depressed by COVID-19. Multiplying the total gain in monthly home production hours of the working-age population at this wage, we estimate the value of monthly home production increased by $26.5 billion between February and April. This gain is equivalent to about 9.1% of the estimated $292.6 billion drop in monthly gross domestic product (GDP) over the same period.Official GDP figures are given only at annual and quarterly rates; here, we rely on seasonally adjusted monthly GDP estimates from Macroeconomic Advisers for January and April.
Devin Werner, a research associate at the Federal Reserve Bank of St. Louis, contributed to this article.
Endnotes
- We analyze the issue more in-depth—for instance, by analyzing the additional effects on home production due to working from home—in our working paper, “Home Production and Leisure During COVID-19.”
- Because of small sample sizes, we distinguish based on spousal employment only for men.
- The latest available ATUS data are for 2019.
- Our working paper describes our methodology in more depth.
- Demographic controls and time dummies are included in the regression, and each observation is weighted with the state’s population. (A time dummy is a variable that equals 1 for a given year and zero for all other years. It controls for time-specific effects.)
- Note that, in categorizing whether an activity is a “home production” or “leisure” activity, we follow the standard categories put forth by Bridgman (2016) and others in the literature.
- Here, unlike elsewhere in this article, we look at changes between January and February, just to emphasize how little aggregate home production was in flux before the recession hit.
- See Mazzolari and Ragusa (2013) for a definition of sectors considered substitutes for home production.
- We specifically use January 2020 CPS data to account for the possibility that wages in later months may have been depressed by COVID-19.
- Official GDP figures are given only at annual and quarterly rates; here, we rely on seasonally adjusted monthly GDP estimates from Macroeconomic Advisers for January and April.
Views expressed in Regional Economist are not necessarily those of the St. Louis Fed or Federal Reserve System.
For the latest insights from our economists and other St. Louis Fed experts, visit On the Economy and subscribe.
Email Us


