


Working from Home: More Americans Are Telecommuting
KEY TAKEAWAYS
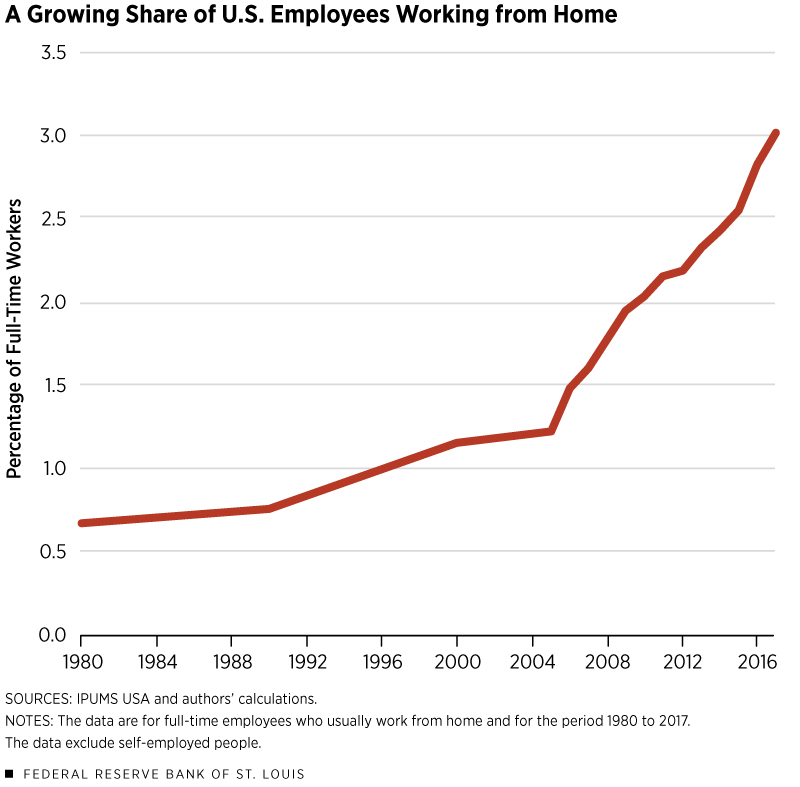
- The share of Americans who primarily work from home has risen in recent decades, from 0.7% of full-time employees in 1980 to 3% in 2017.
- The share of telecommuting workers differs among cities, and this appears to be due to variations in the mix of occupations.
- In 2017, the average worker who usually telecommutes drove more miles annually than the average worker who has to travel to a workplace.

Working from home takes many forms, from a technology worker operating out of a home office to a manager occasionally working away from the office. And the number of American employees who participate in this work arrangement has grown significantly since 1980.
The impact of this growth in telecommuting could have many potential impacts on the economy, including effects on traffic congestion and where households choose to locate. These effects could also be very different from city to city and for different demographics of employees. For example, the share of workers who telecommute can vary across ages, parental status, occupations and education levels, and by whether one lives in a metropolitan area.
In this article, we first focus on understanding the important drivers of telecommuting. We next answer the question: Who is likely to be a telecommuter? Finally, we discuss the implications for worker commutes and housing choices.
The Rise of Telecommuting
For our analysis, we use the decennial census and the Census Bureau’s American Community Survey (ACS), which ask respondents about how they usually commute to work.We access the data through IPUMS USA, a data set from the University of Minnesota that provides easily accessible, well-documented data on individual responses to the decennial census and ACS. In 2017, 3% of full-time workers answered that they primarily “worked at home” in response to this question.We exclude self-employed workers from our analysis. This number omits work done at nonresidential settings, such as coffee shops or coworking spaces, and is thus likely a lower bound on the actual number of employees who work outside the traditional workplace.Working in these nonresidential settings is covered by the Telework Enhancement Act (2010), which defines telework as a “work flexibility arrangement under which an employee performs the duties and responsibilities of such employee’s position, and other authorized activities, from an approved worksite other than the location from which the employee would otherwise work.” However, the available data on the U.S. labor force focus on only people who work from home.
Furthermore, the share of employees who work from home just a few days per month is significantly higher than the share of people who primarily telecommute. For example, using data from the Federal Highway Administration’s 2017 National Household Travel Survey (NHTS), we found that an additional 7% of full-time workers telecommuted four days or more per month.
According to the census data, about 500,000 full-time employees primarily worked from home in 1980, accounting for 0.7% of the workforce. By 2017, this number had increased to 3.4 million employees, or 3% of the workforce. The growth in telecommuting, however, is not linear. As depicted in Figure 1, the share of full-time employees working from home slowly increased until around 2005, after which growth accelerated.The sampling frequency changed from every 10 years to every single year beginning in 2005, so it is possible the growth rate began its acceleration prior to 2005 but after 2000.
Key Drivers of Telecommuting
Technological advancement seems like the most obvious factor leading to the increased ability to work from home. However, we at least must consider the possibility that other factors may also be at play.
Since 1980, the economy has experienced a considerable shift in employment away from manufacturing and production jobs and toward service sector jobs. Manual work is typically difficult to complete off-site, so it is not surprising that the share of workers who telecommute in production occupations and construction and extraction occupations is the lowest across all occupational groups (about 1% each in 2017). A shift in employment away from these and other jobs with a relatively low share of telecommuting would increase the overall telecommuting rate in the economy absent of any new technologies.
Similarly, 5% of workers in management, business and financial occupations and 4% of workers in sales and related occupations telecommuted in 2017. A shift toward jobs like these with a relatively high share of telecommuting would also increase the overall telecommuting rate, again even without any technological advancement.
Using a shift-share analysis, we backed out the effect of shifts in occupations away from jobs with a relatively low share of telecommuting and toward those with a relatively high share of telecommuting. We found that only about 2% of the growth in telecommuting since 1980 can be explained by occupational shifts. Technological advancement likely explains the rest.
Turning our attention to the regional level, Figure 2 shows the share of telecommuters in metropolitan statistical areas across the U.S. in 2017. Telecommuting shares range from below 1% in Houma, La., to nearly 9% in Boulder, Colo
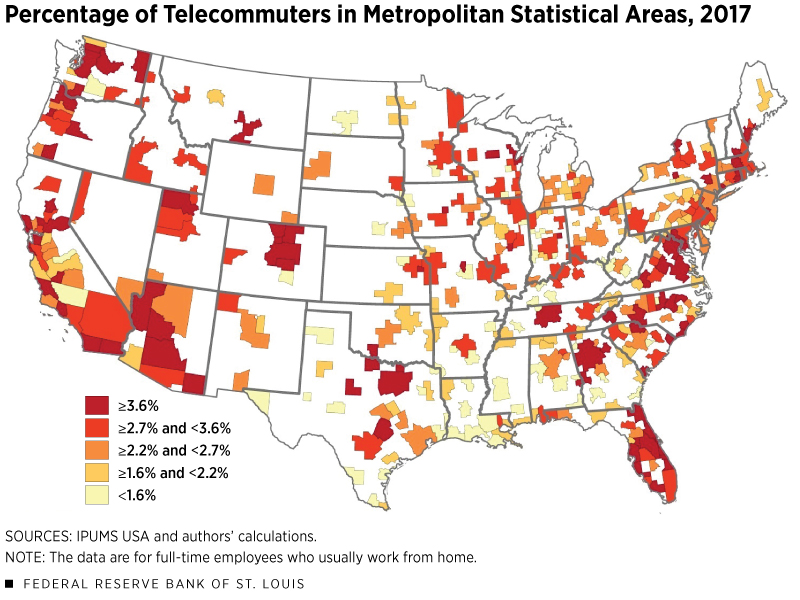
We analyzed the factors that explain why some areas have a higher rate of telecommuting compared with others. While occupation was not a key driver of national growth in working from home over time, we did find it important for explaining geographic variations in telecommuting. Once we controlled for income, a region’s occupational mix was a significant predictor of the telecommuting share in metro areas.
To illustrate, in the four largest metro areas in the Eighth Federal Reserve District,Headquartered in St. Louis, the Eighth Federal Reserve District includes all of Arkansas and parts of Illinois, Indiana, Kentucky, Mississippi, Missouri and Tennessee. St. Louis and Louisville, Ky., had telecommuting shares of 3.1% in 2017, followed by Little Rock, Ark., at 2.7% and Memphis, Tenn., at just below 2.2%.
Part of the differences in these telecommuting rates can be explained by the share of workers in management, business and financial occupations. For example, in St. Louis, 18.6% of workers are in these occupations, which tend to have a higher portion of employees working from home, while only 14.8% of workers are in these occupations in the Memphis metro area.
Looking toward the future, while telecommuting rates likely will continue to grow with further technological advancement, employees in some occupations may never be able to work from home. For example, there will always be a need to have someone physically in an elementary school classroom to ensure discipline, such as calming children when they’re too loud. In 2017, specific occupations with a particularly low share of workers telecommuting included upholsterers, explosives workers, dentists and ambulance drivers.
Who Is Likely To Be a Telecommuter?
In addition to occupation, a worker’s age and level of education and whether one has children or lives in a metro area are important in predicting the likelihood of someone telecommuting. As a worker’s age increases from 25 to 40, the likelihood that the person telecommutes increases slightly, then remains stable through age 65. Moreover, workers with children under 5 in the house are about 14% more likely to telecommute. However, gender does not appear to impact telecommuting rates.
Worker education is an especially important determinant of telecommuting, as those with over 16 years of schooling (i.e., college educated) are 58% more likely to work from home, holding everything else constant. Location also seems to play a major role, specifically residence in a metropolitan area. Controlling for other factors, workers in metro areas are 74% more likely to telecommute than those in nonmetro areas.
When all these various effects are combined, they help explain why some people are much more likely to telecommute than others. To give an example, a college-educated 40-year-old with a young child and who works in sales in a large city is predicted as having a 5.2% chance of being a telecommuter. Meanwhile, a high school-educated 20-year-old with no children and who works in production in a rural area is predicted as having a 0.03% chance of being someone who works from home. The key factors outlined above explain almost all the variation in telecommuting rates across regions of the country.
Implications of Increased Telecommuting
Typically, people choose where to live based on factors such as the commute time to work, housing prices and amenities like local schools, parks and restaurants. When workers have to commute five days per week, they likely will place great emphasis on living relatively close to where they work. However, now that the increase in the prevalence of telecommuting means that fewer people have to physically travel to work every day, people may place more emphasis on affordability, local amenities and other factors when deciding where to reside.
In an analysis of the NHTS, we found that the average worker who usually telecommutes drove almost 18,000 miles in 2017. Meanwhile, the average worker who typically has to travel to work at an office drove just under 15,000 miles in 2017. While we cannot infer causality from these results alone, these numbers do suggest that telecommuting has not eliminated driving time for most employees and could even increase it.
That may seem odd at first, but consider how the ability to telecommute impacts where people want to live. Imagine a group of workers who commute 40 minutes each day, five times a week, for a total of 200 minutes. If their employers give them the ability to work from home twice per week, they have to commute only three days per week.
Some workers would choose to stay exactly where they are and commute only 120 minutes per week. But the data suggest that some workers would actually choose to move farther away from their work location. After all, if they have to travel to work only three times per week, they may not mind a longer commute and may rather move farther out to where housing is often more affordable and amenities often better than in the city center. Even though people commute fewer times per week, their commute could be longer in this scenario, and they may need to travel further for other amenities, resulting in an increase in overall driving.
Conclusion
Although current trends suggest continued growth in telecommuting arrangements for employees, the implications for cities remain unclear. The impact on economic development could be very different from one region to the next due to factors such as relative differences in housing costs. Moreover, we need a better understanding of how workers value their commute: For example, is the total time spent commuting more important than the number of trips? Lastly, what will new technology bring? Autonomous vehicles could make commuting less inconvenient, reducing the desire to work from home, but they may also lead to congestion that could increase commute times.
Endnotes
- We access the data through IPUMS USA, a data set from the University of Minnesota that provides easily accessible, well-documented data on individual responses to the decennial census and ACS.
- We exclude self-employed workers from our analysis.
- Working in these nonresidential settings is covered by the Telework Enhancement Act (2010), which defines telework as a “work flexibility arrangement under which an employee performs the duties and responsibilities of such employee’s position, and other authorized activities, from an approved worksite other than the location from which the employee would otherwise work.” However, the available data on the U.S. labor force focus on only people who work from home.
- The sampling frequency changed from every 10 years to every single year beginning in 2005, so it is possible the growth rate began its acceleration prior to 2005 but after 2000.
- Headquartered in St. Louis, the Eighth Federal Reserve District includes all of Arkansas and parts of Illinois, Indiana, Kentucky, Mississippi, Missouri and Tennessee.
References
Telework Enhancement Act of 2010, Pub. L. No. 111-292, 124 Stat. 3165 (Dec. 9, 2010).


Views expressed in Regional Economist are not necessarily those of the St. Louis Fed or Federal Reserve System.
For the latest insights from our economists and other St. Louis Fed experts, visit On the Economy and subscribe.
Email Us