


A Decade after the Crisis, Has the Global Debt Burden Stabilized?
KEY TAKEAWAYS
- Economies throughout the globe have stretched indebtedness levels to new highs in a relatively short period of time following the global financial crisis.
- Global debt as a percentage of GDP peaked in September 2016; this ratio is showing signs of stabilization in advanced economies, but less so in emerging economies.
- Recent greater easing by major central banks may spur more borrowing, but it is unlikely to replicate the post-crisis debt growth.

The 2008-2009 global financial crisis contributed to a substantial increase in global debt and unleashed a new era of extremely low interest rates, which enabled historically high debt levels to be sustained over time. A convenient proxy for total world debt, measured by the outstanding credit to the nonfinancial sectorCredit to the nonfinancial sector is defined as the following: on the lending side, domestic banks, other domestic financial corporations, nonfinancial corporations and nonresidents; and on the borrowing side, government sector and the private nonfinancial sector, and the latter is further split between nonfinancial corporations and households. Nonfinancial sector debt or credit will be referred to as “debt or credit.” in 43 major economies, shows that nominal “world” debt levels increased to $184 trillion in March 2019 from $115 trillion in March 2009, according to the Bank for International Settlements.
However, the absolute value of global debt is not a very informative number. A better way of understanding its magnitude is measuring global debt as a percentage of gross domestic product (GDP). Using this measure, world debt appears to have peaked at 245% of global output in September 2016 and to have fallen to 238% of global GDP in March 2019.See www.bis.org/statistics/totcredit. The decline since 2016 suggests that post-crisis levels of global debt may finally be stabilizing. Since its peak, the average debt-to-GDP ratio for the 10 quarters ended in March 2019 was 238%. This is up from 207% during the 10 quarters preceding the financial crisis.
Global debt stabilization does not universally assume that all sectors of an economy or even all national economies are simultaneously stabilizing. But rather, individual sectors in the economies most responsible for driving the previous trend have begun to stabilize.
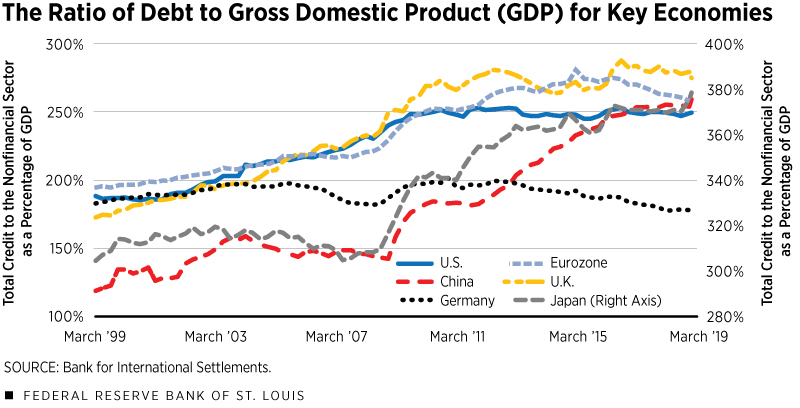
Indeed, different economies follow very different debt trajectories, not least because some economies are able to sustain higher levels of debt over time than others. (See Figure 1.) Although conducting a country-by-country analysis of debt sustainability is beyond the scope of this article, the debt-to-GDP ratio remains a useful metric to gauge the “perceived sustainability” of a particular country’s debt.
Moreover, lower debt servicing costs appear to have allowed many economies to sustain ever higher debt ratios without eliciting negative reaction from financial markets. On the other hand, economies that saw their debt rapidly build up in the past decade might want to rein in historically high debt ratios by implementing policies to try to slow credit expansion.
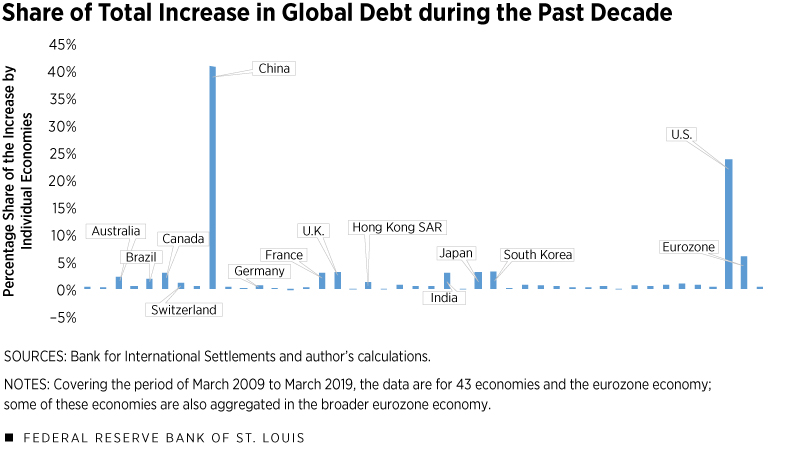
Examining debt levels by economy reveals that debt increases were concentrated in specific economies. (See Figure 2.) In particular, China accounted for 41% of the total global debt increase since March 2009, followed by the U.S. with 24%. Australia, Brazil, Canada, Hong Kong, India, Japan, South Korea, Switzerland and the U.K. together accounted for 21%. The eurozone accounted for 6% of the total global debt increase, half of it from France alone. Advanced economies accumulated generally government debt, as was the case in the U.S., and emerging market economies accumulated mainly corporate debt, particularly in the case of China.
Advanced Economies
The debt-to-GDP ratio in advanced economies peaked at 280% in September 2016 and stood at 267% in March 2019. Government debt in advanced economies was the primary driver of the upward trend until 2016. That is, as households in advanced economies deleveraged, corporations increased their leverage; the two groups more or less offset each other in the last decade. In this context, if government debt stabilizes, so will overall indebtedness, which is precisely the case for some advanced economies, as illustrated in Figure 1.
U.S. government debt increased from 60% to 100% of GDP between 2007 and 2014, and plateaued thereafter, which stabilized the overall U.S. debt-to-GDP ratio, despite increasing nominal government deficits. The 19 eurozone countries have also collectively shown some debt-ratio stabilization, driven by a significantly lower debt-to-GDP ratio in Germany. The exception is Japan, the most indebted advanced economy in the world; its government debt appears to have improved after peaking at 219% of GDP in June 2016, only for the attempted stabilization to be shorted-lived.
Until now, maintaining a stable debt-to-GDP ratio with constant interest rates meant that any increase in the household or corporate sector debt ratio had to be compensated by a decrease in the government debt ratio. However, major central banks have recently started a concerted effort to ease monetary policy in 2019 and possibly in 2020, theoretically allowing economies to accommodate even higher debt-to-GDP ratios.
Emerging Market Economies
The stabilization of debt-to-GDP ratios in the emerging markets is far less clear-cut, as most of these economies have enjoyed unprecedented credit access in the past decade. Emerging markets’ debt peaked later, at 194% of GDP in March 2018, after a decade in which interest rates reached the “zero lower bound” in major advanced economies. By March 2019, debt stood almost unchanged at 193% of GDP, but the share of world indebtedness had changed significantly. In the decade to March 2019, the emerging markets' share of total global debt increased to 31% (up from 16% in March 2009), while the share of global debt held by advanced economies decreased to 69% (down from 84%).
In emerging markets, corporate sector debt played the role that government debt played in advanced economies, driving total indebtedness higher after the global financial crisis. By the end of the decade, up until December 2018, U.S. interest rates had been rising, which also lifted the cost of borrowing in dollar-denominated debt. This “normalization” of U.S. rates would have helped stabilize emerging market debt ratios. However, negative interest rates in some advanced economies are continuing to pressure U.S. interest rates lower, and the Federal Reserve has recently pared back some of its past short-term rate hikes. This will test the perception that emerging market debt ratios are indeed stabilizing.
China and Global Debt
China, an emerging market that has single-handedly been responsible for almost half of the global debt increase in the past decade, requires special consideration. Three previous rounds of credit expansion almost doubled the country’s debt burden since the financial crisis. In March 2019, China’s total debt-to-GDP ratio reached its highest level to date at 259%, up from 158% in March 2009. Looking ahead, there are contradictory arguments about the idea that China’s debt burden might start to stabilize.
- Household indebtedness in China, which started out very low a decade ago, has reached the same level as Germany's (54% of GDP). Although household debt could, in theory, increase to the U.S. level (75% of GDP), this is unlikely in the short run given strict government policy.
- China’s central government demonstrated a renewed policy urgency to restrict credit expansion in 2017 and 2018. However, the stronger-than-expected trade shock has forced authorities to introduce some fiscal stimulus in 2019, albeit a very modest one.
- Government debt, which just surpassed the emerging markets’ debt-to-GDP ratio at 50%, has been consistently underestimated. It is expected that the Chinese consolidated government sector could increase its level of debt toward 80%, in the lower range of the debt-to-GDP ratios among advanced economies, in the medium term.
The debt transparency goal has been in constant tension with the goal to stabilize the debt ratio in an economy that is gradually slowing down. The level of indebtedness of the Chinese nonfinancial corporate sector, of which half of its debts are issued by state-owned entities, not only is above that of most emerging markets but also exceeds by far the level in many advanced economies. As of March 2019, the Chinese nonfinancial corporate sector debt stood at 155% of GDP, compared with an 89% ratio in the similar sector in advanced economies. Even if authorities were to curb the growth of new corporate debt, the opportunity will likely be used to increase transparency of unaccounted debt used in past stimulus spending, either by booking this debt into the government consolidated accounts or swapping it into corporate bonds.
Conclusion
The expansion in global debt after the financial crisis can be explained by government and corporate debt increases; in contrast, the world’s household debt ratio remained flat. This helps explain the rather lackluster pace of the recovery since the crisis, before growth improved in 2017-2018.
The slow recovery was a distinct feature of advanced economies, which saw households deleverage in the past decade. A more dynamic economy since 2017 was expected to encourage households to leverage and government to deleverage at similar rates, thereby allowing the debt ratio to remain constant. This contrasts with the emerging markets’ decadelong expansion, which benefited from lower global rates, increasing household and corporate debt, and positive spillovers from an aggressive Chinese leverage expansion. The normalization of U.S. interest rates was expected to stabilize corporate leverage and emerging market debt ratios at current levels.
It is in this context that the increase in global debt in the decade following the crisis appears to have stabilized of late, as some of the economies most responsible for the previous debt surge have seen debt ratios plateau. However, a concerted effort by major central banks to increase monetary easing and sustain global economic growth, which started to falter early in 2019, could facilitate a return to increasing debt-ratio trajectories.
In advanced economies, the entire private sector could sustain its leverage, while simultaneously the government fails to rein in its debt ratio. Emerging market economies could continue to increase overall private sector leverage to offset the lack of support from Chinese growth and the negative effects of global trade disputes. However, even under these new and changing circumstances, it will take more than the recent decline in global interest rates to replicate the aggressive credit expansion of the past decade.
Endnotes
- Credit to the nonfinancial sector is defined as the following: on the lending side, domestic banks, other domestic financial corporations, nonfinancial corporations and nonresidents; and on the borrowing side, government sector and the private nonfinancial sector, and the latter is further split between nonfinancial corporations and households. Nonfinancial sector debt or credit will be referred to as “debt or credit.”
- See www.bis.org/statistics/totcredit.

Views expressed in Regional Economist are not necessarily those of the St. Louis Fed or Federal Reserve System.
For the latest insights from our economists and other St. Louis Fed experts, visit On the Economy and subscribe.
Email Us