


A Tale of Two Economies: Farmers Struggle despite Strong U.S. Economy
KEY TAKEAWAYS
- Dropping commodity prices have caused net farm income to plunge about 40 percent since its 2013 high and credit conditions to tighten.
- U.S. farmers also face headwinds of record harvests and trade disputes.
- Despite tough market conditions, the farm sector has remained relatively well insulated from potential solvency impacts.
At a time when the overall U.S. economy continues to boom, the U.S. agricultural sector has continued to struggle amid falling farm income and deteriorating agricultural credit conditions.
Over the past five years, U.S. economic growth has continued to strengthen. The growth in U.S. real gross domestic product (GDP) has averaged 2.4 percent per quarter since 2013.
Down on the farm, though, conditions have been far from robust. From 2013 to 2017, net farm income—considered to be a broad measure of farm profitability—fell 39 percent, from $123.8 billion to $75.5 billion.
The farm economy does not always run counter to the rest of the overall economy, but unique conditions this past year—amplified in the Midwest—continue to curb agricultural growth.
In 2012, commodity prices began to soar as a severe drought that summer lingered in the main growing areas of the Midwest, leading to a jump in land values and farm income. Strong domestic and export demand also fueled gains.
Following this 2013 peak, though, crop prices dropped amid increased plantings, good growing conditions and higher crop yields.
While domestic demand remains strong, the decline in its rate of growth has increased the importance of export markets as a source of long-term growth. Indeed, concerns have increased that farm income will fall even lower in 2018 amid trade disputes with China and other countries.
The Significance of the Midwest
Soybeans, cattle, corn, hogs and dairy are among the most valuable agricultural commodities produced in the U.S., of which the Midwest produces the bulk. See the USDA’s Annual Cash Receipts by Commodity database. The Midwest encompasses the states of Illinois, Indiana, Iowa, Kansas, Michigan, Minnesota, Missouri, Nebraska, Ohio, North and South Dakota, and Wisconsin.
About 80 percent of all U.S. commodities are consumed domestically, with 20 percent exported. In 2017, soybeans were the most valuable export from the Midwest, followed by corn, beef, pork, and dairy and eggs. (See Figure 1.)
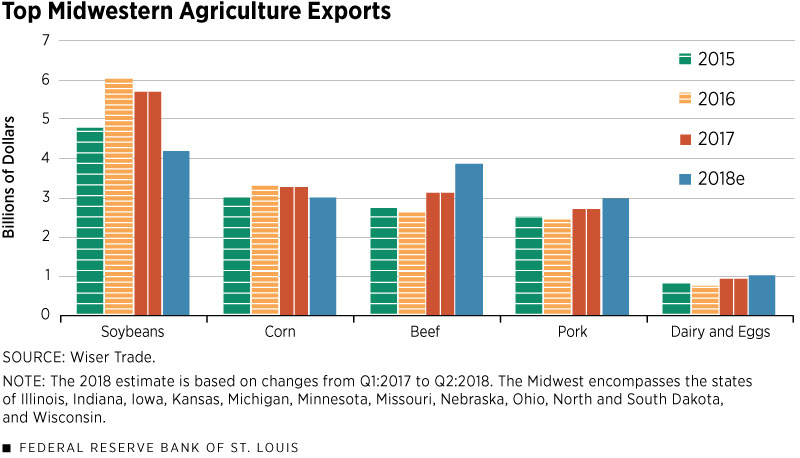
The Midwest produces the majority of U.S. soybeans, which are crushed into soybean meal for livestock feed and into soybean oil for cooking, for both domestic and foreign markets.
Record Harvests and Trade Disputes Portend More Headwinds
In its World Agricultural Supply and Demand Estimates report for September, the U.S. Department of Agriculture (USDA) estimated U.S. soybean production would reach a record 4.7 billion bushel for the 2018-2019 crop year. Yields were expected to average 2.8 bushels per acre, up 3.7 bushels from the previous season. Soybean stockpiles were also expected to reach a record 845 million bushels.
Corn production was forecast at 14.8 billion bushels. Corn yields were expected to average 181.3 bushels per acre, up 4.7 bushels from the 2017-2018 crop year. If realized, this would be the highest corn yield on record in the United States.
Meanwhile, concerns about an ongoing trade war with China, which imposed a 25 percent retaliatory tariff on U.S. soybeans, caused soybean prices to plunge close to a 10-year low this summer. China has long been the largest buyer of U.S. soybeans, purchasing close to 31 percent of U.S. production in 2017. China has also increased its tariffs on U.S. pork products from 25 percent to 62 percent.
Trade disputes with other major U.S. buyers also continue to pressure prices. Some uncertainty still remains about the ultimate outcome of North American Free Trade Agreement (NAFTA) negotiations with Mexico and Canada, despite the Aug. 27 announcement that the U.S. had reached a bilateral agreement on trade with Mexico. In June, Mexico, the largest purchaser of U.S. pork, imposed retaliatory tariffs of 20 percent on U.S. pork, while Canada imposed tariffs of 10 percent on U.S. beef. These tariffs come at a time of near-record U.S. stockpiles of pork, beef and poultry.See the USDA’s Cold Storage Report, Aug. 22, 2018.
Agricultural Lending Impact
While large harvests improve the cash flow of agricultural producers in the short term, they can hurt profitability going forward because of the downward effect on prices. In turn, years of sluggish profits have forced more farmers to take out loans to finance their operations.
In the second quarter of 2018, agricultural bankers across the Midwest reported elevated demand for farm loans, as well as a modest increase in problems with loan repayment, amid reduced agricultural profitability.See Federal Reserve Bank of Chicago, Federal Reserve Bank of Kansas City and Federal Reserve Bank of St. Louis.
In late July, the USDA announced it would implement a $12 billion aid package for all farmers and producers who have been impacted by retaliatory tariffs. A portion of the funding will be administered by USDA under the Commodity Credit Corp. (CCC) Charter Act. First signed into law in 1933 in the midst of the drought-racked Great Depression, the act authorizes the USDA to borrow up to $30 billion from the Department of the Treasury without congressional approval to “stabilize, support, and protect farm income and prices.”
On Aug. 27, the USDA revealed the details for the first tranche of the package, which allotted $4.7 billion for direct payments to corn, cotton, dairy, hog, sorghum, soybean and wheat producers. The majority of the aid, $3.6 billion, is allotted for soybean producers. If needed, USDA officials said a second tranche will be made available starting in January. In addition, the USDA will purchase up to $1.2 billion in commodities for nutrition assistance programs and will make $200 million available to help exporters identify and develop foreign markets for U.S. agricultural products.
While it is still too early to gauge the full extent of the potential impact of bumper crops and tariffs on U.S. farmers’ balance sheets, the outlook for 2018 shows a further decline in net farm income to $65.7 billion, according to the USDA’s Farm Income Forecast released on Aug. 30.See the USDA’s August 2018 Farm Income Forecast. However, farmland values appear to have remained relatively steady during all of this volatility. Farmland values can comprise more than 80 percent of the total value of farm assets; so, the debt-to-asset ratio, a common measure of solvency, is an important measure.
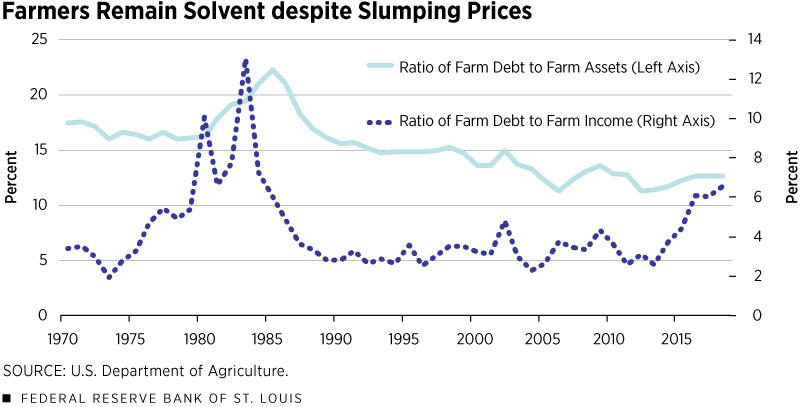
As shown in Figure 2, the farm sector appears to remain relatively well insulated from potential solvency impacts because the debt-to-asset ratio remains relatively low by historical standards.
Endnotes
- See the USDA’s Annual Cash Receipts by Commodity database.
- See the USDA’s Cold Storage Report, Aug. 22, 2018.
- See Federal Reserve Bank of Chicago, Federal Reserve Bank of Kansas City and Federal Reserve Bank of St. Louis.
- See the USDA’s August 2018 Farm Income Forecast.
References
Federal Reserve Bank of Kansas City. A Dip in the Farm Economy. Ag Credit Survey, Aug. 9, 2018.
Federal Reserve Bank of St. Louis. Agricultural Finance Monitor, Second Quarter 2018.
U.S. Department of Agriculture. World Agricultural Supply and Demand Estimates, Sept. 12, 2018.


Views expressed in Regional Economist are not necessarily those of the St. Louis Fed or Federal Reserve System.
For the latest insights from our economists and other St. Louis Fed experts, visit On the Economy and subscribe.
Email Us