


Soybeans, the Eighth District’s No. 1 Crop, Caught in Trade Tussle
KEY TAKEAWAYS
- Soybeans are an important agricultural crop in the U.S. and the Eighth Federal Reserve District. The commodity is mainly produced in the U.S. and Brazil.
- U.S. and regional farmers face uncertainty after China, the world’s biggest importer of soybeans, imposed a tariff on U.S. soybean imports.
- While the result of the tariff is difficult to predict, economic models indicate a negative impact for both the U.S. and China, with significantly reduced U.S. soybean production.
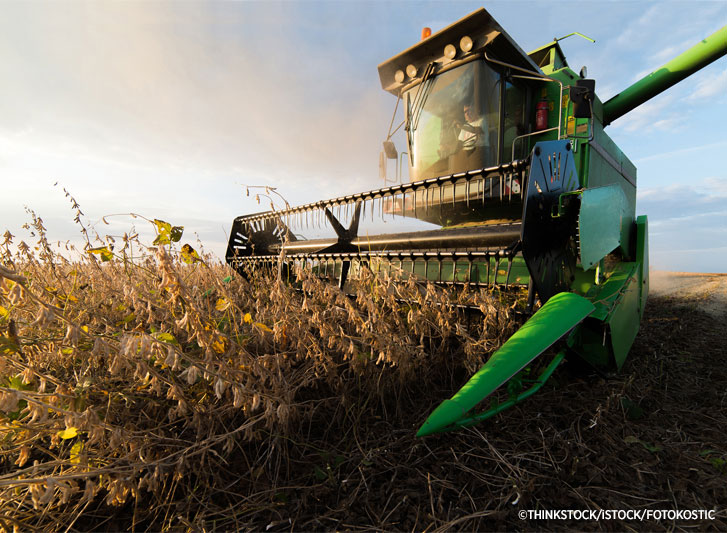
Tofu, animal feed and crayons: It sounds like the beginning of a bad joke, but the commonality found in this strange combination of everyday products is anything but trivial. Each item relies on the same crop, potentially from the same farmer or even the same plant. With astonishing diversity of uses, soybeans have exploded in popularity.
Soybean processing primarily yields high protein soybean meal and soybean oil, as soybeans are composed of 38 percent protein and 18 percent oil.See North Carolina Soybean Producers Association. Livestock, such as hogs and cattle, almost exclusively consume the world’s production of soybean meal. Humans primarily use soybean oil for cooking. Edamame, simply pre-ripened soybeans, is a growing, yet globally popular, way to enjoy the crop.
And now this key crop is being targeted in global trade negotiations. In July, China imposed a 25 percent tariff on U.S. soybean imports and other products after the U.S. imposed tariffs on Chinese goods. In this article, we examine the role of soybeans in both the U.S. and the Eighth Federal Reserve DistrictHeadquartered in St. Louis, the Eighth Federal Reserve District includes all of Arkansas and parts of Illinois, Indiana, Kentucky, Mississippi, Missouri and Tennessee. as well as their role in global trade.
U.S. and Brazil Are World’s Largest Producers
In the 2016-17 crop year,The 2016-2017 crop year roughly covers the beginning of the Northern Hemisphere planting season in 2016 through the end of the Southern Hemisphere harvest and marketing season in 2017. We use this period for our global analysis because, at the time of writing, only preliminary estimates were available for the Southern Hemisphere from the 2017-2018 crop year. 297 million acres of land grew 350 million metric tons of soybeans worldwide. Only wheat, rice and corn superseded the total acreage of soybeans. The U.S. and Brazil produced 66 percent of all soybeans worldwide, 33 percent each.
In the U.S., soybeans are grown mostly in the Mississippi River watershed, with 26 of the 31 soybean-producing states in 2017 having a portion of their territories fall within the watershed. Those 26 states accounted for 99 percent of 2017 domestic production. Combined, Illinois and Iowa produced 27 percent of the 2017 soybean crop.
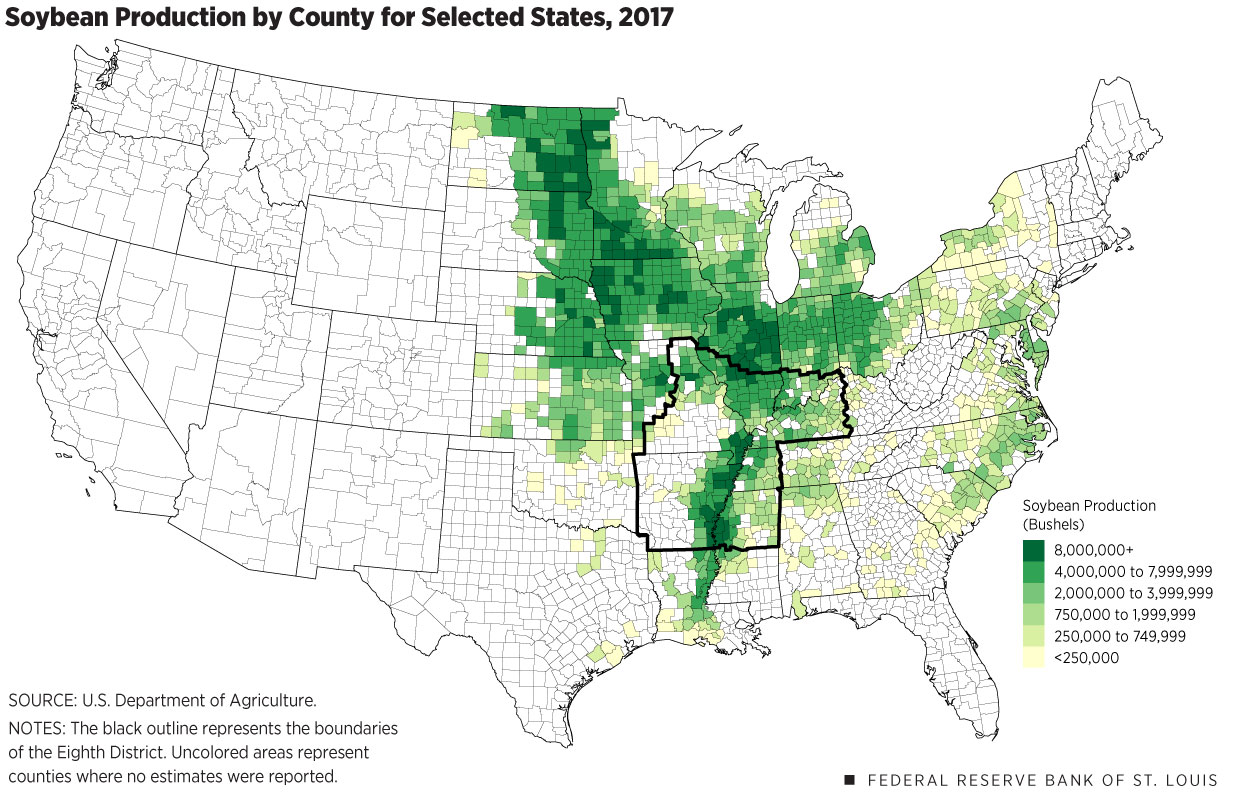
Figure 1 shows soybean production by county; it highlights the role of the Mississippi River Basin, with most high-production counties lying along the river, or sandwiched between the Mississippi and one of its major tributaries.See USDA, 2017.
The Eighth District is outlined on the map. Soybeans were the most planted crop in the District, with almost twice as many acres as corn and 15 times as many acres as wheat. The District produced 19 percent of U.S. soybeans in 2017. Its pattern of production was consistent with that of the rest of the U.S.: The top 10 soybean-producing counties in the District lie along the Mississippi River or are separated from the Mississippi River by one county.
The District’s involvement in the soybean industry goes beyond growing the crop. It is home to multiple soybean processing plants and the headquarters of agribusiness Bunge North America. The District is also home to Bayer’s Crop Science Division, the subsidiary that absorbed Monsanto Co. after Bayer completed its acquisition of the U.S. seed giant; the division provides conventional and genetically modified soybean seeds, as well as pesticides and herbicides, to farmers across the world.
Consumption and Trade
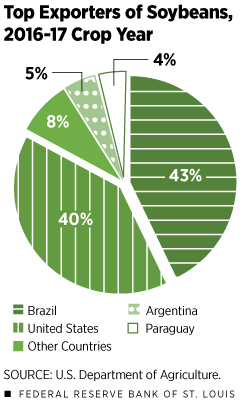
As seen in Figure 2, the U.S. and Brazil combined accounted for 83 percent of global soybean exports in the 2016-17 crop year. China was far and away the largest global importer, buying 65 percent of global exports. China also dominated global consumption, accounting for 31 percent of the global total; the U.S. was a distant No. 2, at 17 percent.Data on acres and production are from the USDA, 2018a. Data on consumption, imports and exports are from the USDA, 2018b.
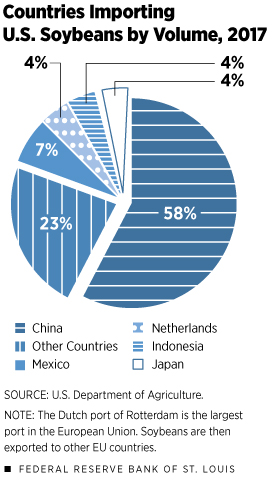
Focusing on the U.S., soybean exports equaled 46 percent of domestic soybean production in 2017. Figure 3 provides a breakdown of export destinations. China and Mexico were the two largest importers, accounting for 58 percent and 7 percent of U.S. soybean exports, respectively.
Among all U.S. goods exports in 2017, soybeans accounted for 1.6 percent of total value;See National Oilseed Processors Association. this was the greatest share of any single food, beverage or feed product exported.
Exported soybeans are shipped through either the Pacific Northwest or the Gulf Coast. In 2013, exporters shipped 60 percent of soybeans through the Gulf Coast using inland barges as the preferred method. However, relative transportation costs do sometimes fluctuate, and this can lead to more soybeans being shipped via the Pacific Northwest.See Denicoff et al.
The Impact of Tariffs
Recent fluctuations in soybean prices demonstrate the traditional economic theory of supply and demand. From 2011 to 2014, higher soybean prices enticed farmers to produce more soybeans. In addition to more crops being planted, farming techniques improved with better technologies and resources. Both factors contributed to a surge in supply.In addition to production decisions, the other important yet least predictable determinants of price are weather and disease.
Initially, the increased supply faced growing demand from a larger global population with ever greater incomes.See USDA, 2016b. From just 2011 to 2014, China, the largest importer of U.S. soybeans, saw a 36 percent increase in gross domestic product (GDP) per capita, which increased the demand for soybean meal-consuming pigs.See World Bank.
Starting in 2015, farmers’ willingness to increase production waned because of lower prices due to slower population and income growth in China, combined with a greater global supply of soybeans.See USDA, 2016a. With lower prices of soybeans and other grains, many U.S. farmers have struggled to break even in recent years. While there haven’t been any indications of major reductions in farming activity up to this point, there have been several reports of farmers’ equity shrinking significantly. Thus, farm consolidation and outright closing are expected if prices remain low.
Prospective soybean tariffs, the most discussed downside risk to U.S. soybeans in recent months, have already affected soybean prices. U.S. future prices declined about $2 a bushel in the spring after the Chinese announcement of a potential 25 percent tariff on U.S. soybeans. China imports 90 percent of the soybeans it consumes, with 30 percent originating in the U.S. Furthermore, reports from earlier this year indicated that Chinese buyers were canceling orders for U.S. soybeans, in part due to fears that the tariff increase would be enacted before purchases entered China. Those fears were fulfilled when China imposed tariffs in July.
Estimating the impact of an economic shock like a tariff is challenging because these shocks trigger a sequence of events that ripple through the economy. Economists design models to capture as many of these events as possible. Data can be used to estimate many of these relationships; however, one is always forced to impose certain assumptions.
In this case, a critical assumption is needed about how Chinese consumers will respond to the tariff. On the one hand, the demand for soybeans may be relatively inelastic because the price of beans is relatively low; it is just one input into the cost of raising pigs. On the other hand, there are substitutes for U.S. beans—primarily beans from other countries—that would increase the elasticity of demand.
Economists Farzad Taheripour and Wallace E. Tyner at Purdue University used an economic model to estimate the impact of the Chinese tariffs.See Taheripour and Tyner. The magnitude of the economic impact is very sensitive to their assumption of trade elasticities, but some main findings hold. First, global economic welfare declines: Welfare declines more in the U.S. than in China, while welfare increases in Brazil. Second, over time, China produces slightly more soybeans, while the U.S. produces far less, as farmers plant other crops; increased production in Brazil further offsets the decline in U.S. production. Third, the U.S. increases its exports to the European Union, as Brazil shifts exports to China.
Even with assumptions and estimates, economic models often fail to incorporate critical variables necessary for accurate projections. In this case, principle factors like exchange rate movements due to external forces could lead to price changes, and weather conditions play a key role in determining crop yields and overall production levels.
Conclusion
Soybeans are one of the most produced and used agricultural products in the world, the U.S. and the Eighth District. In recent months, strained U.S.-China trade relations have also made the crop one of the most widely discussed commodities.
Concerns regarding China’s tariff on U.S. soybeans are met with multiple mitigating factors. First, proposed aid for farmers potentially offsets the drastic effects of lower prices, albeit not completely neutralizing the negative effects. Additionally, Chinese consumers’ growing reliance on U.S. soybeans demonstrates an increasingly inelastic demand pattern for soybeans.
In the end, projections indicate these tariffs will place considerable costs on both the U.S. and China. A world with higher tariffs may be business as usual for the American farmer, but, as always, much remains to be determined by the weather.
At the time this was written, Camilla Adams was a research intern at the Federal Reserve Bank of St. Louis.
At the time this was written, Jonas Crews was a senior research associate at the Federal Reserve Bank of St. Louis. He is currently a research associate at the Walton Family Foundation.
Endnotes
- See North Carolina Soybean Producers Association.
- Headquartered in St. Louis, the Eighth Federal Reserve District includes all of Arkansas and parts of Illinois, Indiana, Kentucky, Mississippi, Missouri and Tennessee.
- The 2016-2017 crop year roughly covers the beginning of the Northern Hemisphere planting season in 2016 through the end of the Southern Hemisphere harvest and marketing season in 2017. We use this period for our global analysis because, at the time of writing, only preliminary estimates were available for the Southern Hemisphere from the 2017-2018 crop year.
- See USDA, 2017.
- Data on acres and production are from the USDA, 2018a. Data on consumption, imports and exports are from the USDA, 2018b.
- See National Oilseed Processors Association.
- See Denicoff et al.
- In addition to production decisions, the other important yet least predictable determinants of price are weather and disease.
- See USDA, 2016b.
- See World Bank.
- See USDA, 2016a.
- See Taheripour and Tyner.
References
Denicoff, Marina; Prater, Marvin; and Bahizi, Pierre. Soybean Transportation Profile. October 2014.
National Oilseed Processors Association. Top 10 Destinations for U.S. Soybean Exports 2015-2017.
North Carolina Soybean Producers Association. Uses of Soybeans.
Taheripour, Farzad; and Tyner, Wallace E. Impacts of Possible Chinese 25% Tariff on U.S. Soybeans and Other Agricultural Commodities. Choices, Second Quarter 2018, Vol. 33, No. 2.
U.S. Department of Agriculture. World Agricultural Production. May 2018a.
U.S. Department of Agriculture. World Agricultural Supply and Demand Estimates. May 2018b.

Views expressed in Regional Economist are not necessarily those of the St. Louis Fed or Federal Reserve System.
For the latest insights from our economists and other St. Louis Fed experts, visit On the Economy and subscribe.
Email Us