


Taking a Closer Look at U.S. Exports to China
KEY TAKEAWAYS
- U.S. tariffs on Chinese goods will affect American exporters as China retaliates, imported inputs become more expensive and protected U.S. industries draw more resources.
- Aircraft, soybeans, motor vehicles and microchips are top U.S. exports to China. Since 2001, the share of these exports going to China has increased sharply.
- Soybeans and motor vehicles are targets of recent Chinese tariffs. Production of these two exports is geographically concentrated.
Debate on Sino-American trade relations has focused on China’s hefty share of the U.S. merchandise trade deficit—46 percent of the $800 billion deficit last year was with China alone—and the national impact of tariffs recently imposed by both countries. Among other parties, U.S. exporters to China are facing the prospect of losing revenue, with the largest effects likely to be felt by states where production of these goods is concentrated.
In this article, we discuss how trade policy may affect overall U.S. exports, look at the top U.S.-China merchandise export categories and then identify the top producing states for these goods. We conclude with a brief discussion of the status of the current U.S.-China trade war and its impact on U.S. exports to China.
Effects of Trade Policy on Exports
International trade allows nations to specialize along the lines of comparative advantage. The U.S. enjoys comparative advantage in products ranging from civilian aircraft to agricultural commodities like soybeans. Producers of these goods seek markets abroad through the reduction of trade barriers. On the other hand, sectors where the U.S. does not have a comparative advantage (e.g., iron and steel) benefit from greater trade barriers because of reduced foreign competition.
Unfortunately, protecting industries that do not have comparative advantage (i.e., import-competing industries) is not costless for exporting industries. There are several channels through which a nation’s import protection can affect its exports—we discuss three important ones next.
First, as a nation devotes more resources to import-competing industries, it has fewer resources left to use in its export industries. In the long run, production in exporting industries must fall, and this, in turn, will reduce exports. In other words, import protection has the unfortunate effect of export reduction.International trade economists refer to this concept as the “Lerner Symmetry Theorem,” which says that an import tariff has effects that are equivalent to an export tax.
A second, more direct channel is retaliatory tariffs imposed by foreign nations. For example, when U.S. imposes tariffs on Chinese steel imports and China retaliates by imposing tariffs on U.S. soybeans, U.S. soybean exports are hurt.
Third, tariffs raise the prices of imported inputs that U.S. exporting firms need to make export goods, which renders U.S. exports less competitive.
While imports have led to job losses in the U.S. manufacturing sector, exports have boosted other sectors. The sectors that export the most to China, however, stand to suffer directly from the escalating Sino-American trade tensions. In addition, higher tariffs will escalate the cost of Chinese intermediate inputs that U.S. firms use in their global supply chains, which can also hurt U.S. exports to other nations.
Next, we look at the top four merchandise-exporting sectors to China (in terms of 2017 exports in dollars) between 1991 and 2017. Last year is the most recent year for available data, while 1991 precedes China’s entry into the World Trade Organization (WTO) exactly by a decade. Therefore, our start date provides a useful benchmark to follow U.S.-China exports before its entry into the WTO and since that time.
Top U.S. Exports to China
In 2017, the top export category to China was civilian aircraft, at around $16.26 billion, followed by soybeans, at around $12.25 billion. The third-highest export was motor vehicles, at $10.3 billion, and fourth was electronic integrated circuits, at around $5.29 billion.
We pose three questions vis-a-vis these exports. First, how have these exports evolved since 1991? Second, how important is China in terms of the global market for these exports? Third, how important are these exports in terms of aggregate U.S. production of these goods?
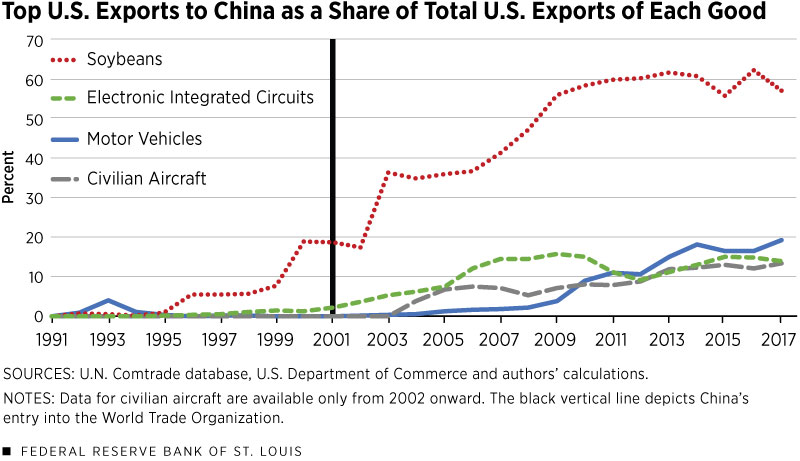
Figure 1 charts the top four merchandise-export categories as a share of global U.S. exports in these same goods starting from 1991. China’s share of these four export categories has gone up significantly in the years following that country’s entry into the WTO. For example, the value of soybean exports to China climbed from around 19 percent of global U.S. soybean exports in 2001 to around 57 percent in 2017, while motor vehicle exports to China jumped from a negligible level of 0.08 percent in 2001 to around 19 percent of global U.S. motor vehicle exports in 2017. Civilian aircraft exports also climbed sharply from negligible levels to around 13 percent of global U.S. exports in this category.
The rise in electronic integrated circuit exports (from 2 percent in 2001 to13 percent in 2017) is probably the result of global supply chain linkages, in which products exported by the U.S. may be used to make other products that are imported into the U.S. For example, Intel computer chips are used as an intermediate input in imported computers. Regardless, exports in this category, even if due to global supply chain linkages, lead to specialization and increased productivity, potentially benefiting all parties.For example, Princeton economists Gene Grossman and Esteban Rossi-Hansberg show that offshoring of some production tasks can raise domestic wages through a productivity effect in spite of greater competition from cheaper foreign labor.
One metric relevant to our third question is the ratio of exports to China to total U.S. output of the relevant industry. If this ratio is small, disruptions in exports to China are unlikely to cause major losses for producers and workers in these sectors.
To compute this ratio, we used the data on industry-level gross domestic output published by the Bureau of Economic Analysis (BEA) for the year 2016. The ratio of soybean exports to China to U.S. farm output in 2016 was around 10 percent, while the ratio of civilian aircraft exports to U.S. durable manufacturing output was 1.2 percent. Motor vehicle exports to China as a share of total U.S. durable manufacturing were 0.7 percent, while the analogous ratio for electronic integrated circuits was 0.4 percent.
Electronic integrated circuits are intermediate inputs that can potentially find markets elsewhere; they also have a relatively low export-to-production share. For those reasons, we focused our state-level analysis on soybeans, aircraft and motor vehicles.
Disruptions to trade in these three categories are likely to be most starkly felt by states where the production of these goods is concentrated. Accordingly, we identified the top producing states of these goods to get a sense of the likely dispersion of export damage across states.
Top Producing States
While civilian aircraft are the top U.S. export to China, they are not yet subject to major retaliatory tariffs. For motor vehicles, the U.S. is not as dependent on exports to the Chinese market because of its own large domestic market and other export destinations. Given these facts and space considerations, we have presented a chart (Figure 2) of only the regional dispersion of soybean production; civilian aircraft and motor vehicle charts are available from the authors on request.
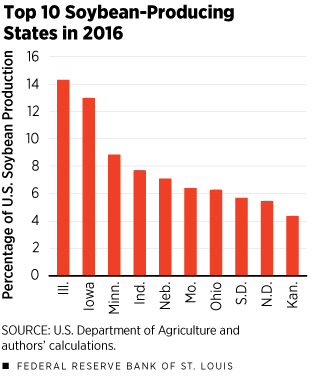
Figure 2 identifies the top 10 soybean-producing states, which together account for around 79 percent of U.S. soybean production. Illinois tops the list, at around 14 percent, while Iowa is second, at around 13 percent. Clearly, the impact of the trade war and its consequences (e.g., declining soybean prices) will be most directly felt by farmers and farmworkers in these top producing states.
Aerospace manufacturing is concentrated in the states of Washington (around 25 percent) and California (around 11 percent). Motor vehicle production is also concentrated, with Michigan (around 24 percent) and Indiana (around 12 percent) accounting for more than a third of U.S. output.
Current Status of the Trade War
Earlier this year, the U.S. announced plans to impose tariffs on $50 billion worth of Chinese goods, which led China to threaten to impose its own tariffs on American goods. The first round of U.S. tariffs on Chinese imports worth about $34 billion went into effect on July 6; that same day, China imposed tariffs on a similar amount of U.S. products. On Aug. 23, the remaining U.S. tariffs on $16 billion worth of imports were implemented; that same day, Chinese tariffs on $16 billion of U.S. goods took effect.
Major U.S. exports targeted by the Chinese tariffs include soybeans and vehicles, parts and accessories. Thus, two of the top four export categories to China are caught in this trade war. Commercial jets, airplane engines and other aviation equipment were not included in the most recent Chinese tariffs, but that could change if trade tensions mount. The U.S. already proposed tariffs on approximately $200 billion of Chinese goods, though they haven’t yet been imposed; China has vowed to counter those measures. Still, both sides held trade talks in late August, and it is possible that an agreement will eventually be reached that alleviates these trade tensions.
Suryadipta Roy is an associate professor of economics at High Point University in North Carolina.
Endnotes
- International trade economists refer to this concept as the “Lerner Symmetry Theorem,” which says that an import tariff has effects that are equivalent to an export tax.
- For example, Princeton economists Gene Grossman and Esteban Rossi-Hansberg show that offshoring of some production tasks can raise domestic wages through a productivity effect in spite of greater competition from cheaper foreign labor.
References
Aerospace Industries Association. State Fact Sheet. 2017.
Grossman, Gene M.; and Rossi-Hansberg, Esteban. Trading Tasks: A Simple Theory of Offshoring. American Economic Review, December 2008, Vol. 98, No. 5, pp. 1978-97.


Views expressed in Regional Economist are not necessarily those of the St. Louis Fed or Federal Reserve System.
For the latest insights from our economists and other St. Louis Fed experts, visit On the Economy and subscribe.
Email Us