State Government Expenditures by Party Affiliation
KEY TAKEAWAYS
- Although U.S. political divisions have widened, research has not shown a correlation between states’ political leanings and their spending.
- Republican-leaning states tend to spend more on transportation, but the correlation is weak.
- More nuanced research is needed to find a causal relationship between political leanings and state expenditures.
Over the past few decades, political divisions in the United States have appeared to deepen, reaching chasmic levels in recent months. A survey conducted just before the 2020 presidential election indicated that about 90% of registered voters in the Republican and Democratic parties expressed concern that a victory by the other side would lead to “lasting harm” in the United States.
The COVID-19 pandemic also has called attention to the depth of these divisions in comparison to other countries; in a survey conducted in summer 2020, 77% of Americans said divisions in the U.S. had escalated since the outbreak, compared with a median of 47% in the 13 other nations surveyed.
Republicans and Democrats traditionally disagree on issues such as education, social assistance, law enforcement and tax policy. However, the question remains whether these ideological divides result in very different policies.
Previous findings indicate that total state expenditures are not correlated with political leanings. In this article, we further that analysis by evaluating whether there is any correlation between state political leanings and state government expenditures on various types of services.
While these results do not offer any causal implications, they shed light on the notion that political rhetoric is insufficient to ascertain the true relationship between state political leanings and government expenditures, and that more nuanced empirical research is needed.
A Look at the Data
To begin our research, we used state and local government expenditures data from the Annual Survey of State and Local Government Finances conducted by the Census Bureau to measure state government expenditures and state legislator data from the National Conference of State LegislaturesThe one exception to this is the state of Nebraska. Nebraska has a unicameral state legislature, consisting of just a state Senate, and its legislators have no official party affiliations. Therefore, we used the Ballotpedia evaluation of Nebraska state legislator party affiliation from 2014 to 2018 (all data available) to calculate the measure for Nebraska. to measure state political leanings.
The major government expenditure categories defined by the expenditure survey are:
- Education Services: Expenditures related to primary and secondary education, as well as higher education and library services.
- Social Services and Income Maintenance: Expenditures related to public welfare (e.g., spending on means-tested programs such as Medicaid and Temporary Assistance for Needy Families), hospitals, health, social insurance administration and veterans services.
- Transportation: Expenditures related to highways, airports, parking facilities and port facilities.
- Public Safety: Expenditures related to police and fire protection, correctional facilities, and protective inspection and regulation.
- Environment and Housing: Expenditures related to natural resources, parks and recreation, housing and community development, sewerage and solid waste management.
To make expenditures comparable across states, we evaluated them as a ratio of state gross domestic product (GDP), consistent with typical comparisons of state expenditures. We used government expenditure and GDP data from 2018, the most recent available.
We measured state political leanings as the average proportion of Democratic state legislators (state Senate and state House of Representatives combined) minus the corresponding share of Republican state legislators from 2009 to 2018. The resulting measurement of state political leanings can then range from -1 (100% Republican leaning) to 1 (100% Democratic leaning), with an increase in the index reflecting a stronger Democratic influence in a state’s legislature.
We used an average of proportions over the decade because public finance policy typically evolves over time. The map below shows our measure of state political leanings, with blue states indicating larger shares of Democrats in state legislatures and red states indicating larger shares of Republicans. The map largely aligns with typical rhetoric about state political affiliations, displaying the more liberal West Coast and Northeast regions and the more conservative South and Midwest.

SOURCES: National Conference of State Legislatures, Ballotpedia and authors’ calculations.
Our Analysis
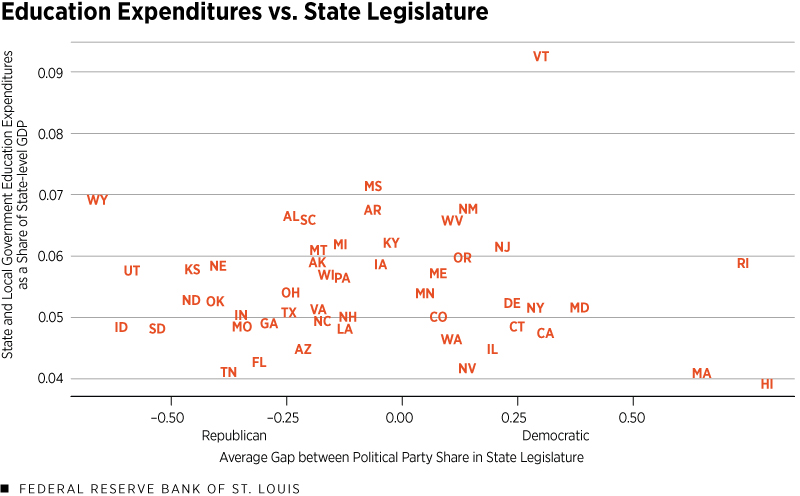
The center column of the first table below reports the correlation coefficients between state political leanings (2009-18) and each expenditure category (as a ratio of state GDP). A correlation coefficient ranges from -1 to 1, with -1 indicating a perfect negative relationship, whereby the less Democratic-leaning a state is, the more it spends on a given category. A 1 indicates a perfect positive relationship, whereby the more Democratic-leaning a state is, the more it spends on a given category. The value 0 indicates no relationship. Typically, a correlation coefficient of magnitude 0.7 or higher is considered a strong correlation.
| Expenditure Category (as a Share of State GDP) |
Correlation with Political Leanings Measure (2009-18) |
Correlation with Political Leanings Measure (2014-18) |
|---|---|---|
| Education | –0.05 | –0.09 |
| Social Services and Income Maintenance | 0.10 | 0.03 |
| Transportation | –0.22 | –0.24 |
| Public Safety | 0.16 | 0.20 |
| Environment and Housing | 0.07 | 0.08 |
| SOURCES: Census Bureau, Bureau of Economic Analysis, National Conference of State Legislatures, Ballotpedia and authors’ calculations. | ||
Each expenditure category exhibits little to no correlation with political leanings. If we redefine the political leanings measure as the average from 2014 to 2018—because politics have become increasingly more divisive in recent years—correlations remain weak (displayed in the right column of the table).
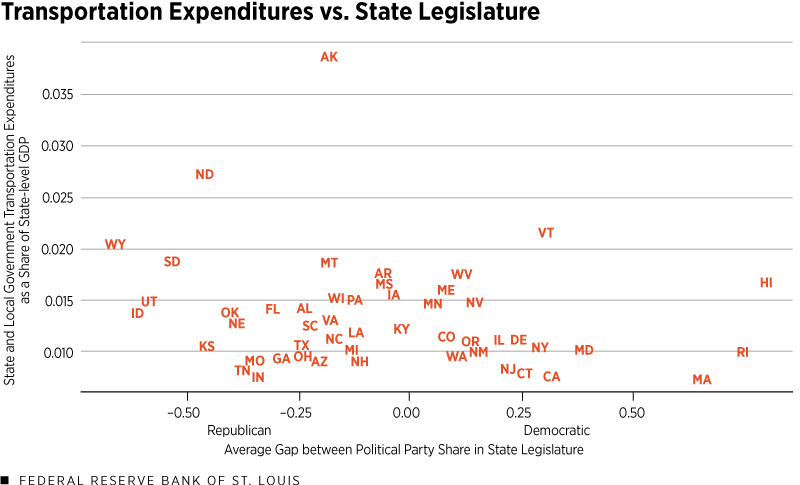
We observe the highest-magnitude correlation of -0.22 for the transportation category in our primary analysis, indicating that more Republican-leaning states tend to spend more on transportation, but that correlation is still quite weak. Moreover, factors other than political leanings may drive the observed correlation; differences in highway expenditures can arise for a number of reasons, such as how many drivers are on the roads or how many lane miles are in a state. For example, Midwestern and Southern (red) states tend to have larger land areas than many of the Northeastern (blue) states, and therefore may have more roadways to maintain.
The figures below help in visualizing the lack of relationship between state political leanings and expenditures (as a share of GDP) for education and transportation—the categories with the weakest and strongest correlations, respectively. Despite the divides in ideology and rhetoric between left- and right-leaning politics, we do not see obvious differences in the spending patterns of red and blue states at this level of government policy.


SOURCES: Census Bureau, Bureau of Economic Analysis, National Conference of State Legislatures, Ballotpedia and authors’ calculations.
To test the robustness of these results, we also evaluated the correlations between political leanings and expenditure categories, with expenditures measured as a share of total state expenditures. The second table below reports the results of the original analysis (center column) as well as the results of the robustness check (right column).
| Expenditure (as a Share of State GDP) vs. Political Leanings Measure (2009-18) | Expenditure (as a Share of Total State Expenditures) vs. Political Leanings Measure (2009-18) | |
|---|---|---|
| Education | –0.05 | –0.25 |
| Social Services and Income Maintenance | 0.10 | 0.04 |
| Transportation | –0.22 | –0.33 |
| Public Safety | 0.16 | 0.07 |
| Environment and Housing | 0.07 | 0.00 |
| SOURCES: Census Bureau, Bureau of Economic Analysis, National Conference of State Legislatures, Ballotpedia and authors’ calculations. | ||
The correlations between political leanings and state expenditures as a share of total expenditures remain weak. We do observe a slightly stronger relationship between political leanings and transportation/education expenditures, both indicating that Republican-leaning states tend to spend higher fractions of their total expenditures in those categories. However, these correlations remain weak overall.
Conclusion
The political atmosphere in the U.S. has certainly become more divisive in recent years, and ideologies on either side of the spectrum have appeared to diverge dramatically. However, our analysis demonstrates that no apparent correlation exists between state political leanings and government expenditure patterns, and that we need more nuanced empirical research to robustly ascertain the causal relationship (or lack thereof) between the two.
Among other complexities, further analysis would need to consider other state legislature dynamics (e.g., whether the executive and legislative branches have the same or opposite political parties), as well as factors other than political leanings (e.g., economic conditions, demographics) that affect government expenditures.
Endnote
- The one exception to this is the state of Nebraska. Nebraska has a unicameral state legislature, consisting of just a state Senate, and its legislators have no official party affiliations. Therefore, we used the Ballotpedia evaluation of Nebraska state legislator party affiliation from 2014 to 2018 (all data available) to calculate the measure for Nebraska.
Views expressed in Regional Economist are not necessarily those of the St. Louis Fed or Federal Reserve System.
For the latest insights from our economists and other St. Louis Fed experts, visit On the Economy and subscribe.
Email Us


