


How Many People Does It Take to Start a Company?
KEY TAKEAWAYS
- Startup sizes have been declining. The average number of employees in a startup decreased from five in 1994 to four in 2019, a 20% drop.
- A similar trend held for states in the Eighth District, with startups in Missouri contracting the most.
- Changes in startup size varied across industries, implying that the overall decline was driven by some industries more than others.
When it comes to startups, public attention has mostly focused on household names:
- Bill Gates and Paul Allen launching Microsoft in 1975
- Larry Page and Sergey Brin establishing Google in 1998
- Jeff Bezos creating Amazon in 1994
Great founders are necessary for the success of startups, of course. But just like any established firm, a startup also needs workers for its underlying operations. The question is: How many?
For this article, we analyzed the average number of employees working at startups in the U.S. between 1994 and 2019 (the earliest and latest years available in our sample). Our analysis also extends to the seven states in the Eighth Federal Reserve DistrictThese seven states are Arkansas, Illinois, Indiana, Kentucky, Mississippi, Missouri and Tennessee. Arkansas is the only state entirely in the Eighth District, with the other states split among districts. Nevertheless, we conduct our analysis on these seven states in total, since we use state-level data. and various representative industries.
Such analysis allows us to follow up on our previous article, which found that the proportion of workers hired by startups (the startup employment share) has declined over time. Analyzing average startup size allows us to see whether this decline comes from a relative drop in the number of startups, the relative size of startups or both.
The data sources for this study, as in our previous study, are the Business Employment Dynamics (BED) program and the Quarterly Census of Employment and Wages. Both are published by the U.S. Bureau of Labor Statistics and cover around 97% of all wage and salary civilian employment in the country. The data set contains information about firm age“Firm age” is the age of the firm’s oldest establishment, in which “establishment age” is defined as the difference between the current year and the first year the establishment reported positive employment. and firm size,“Firm size” is the number of employees registered under a firm, whether full time or part time and whether temporary or permanent. We specifically looked at “average size,” which is the average of employment in March of the reporting year and employment in March of the previous year. This means that a single individual holding multiple jobs would likely be counted multiple times. in which “firms” are legal businesses issued an employer identification number by the IRS. Startups are defined as establishments tied to a firm that is less than a year old.It is probably more intuitive to think of a “startup” as the new firm itself, and not its establishment(s). However, our sources lack the necessary firm-level data to do so, so we defined “startups” at the establishment level instead. A quick analysis of a related data set (the BED project)—which has both firm-level and establishment-level data—shows that the vast majority of new firms open with only one establishment each, so the two definitions can be viewed as roughly interchangeable.
Overall Startup Size
Figure 1 displays national and regional statistics of startup size between 1994 and 2019.
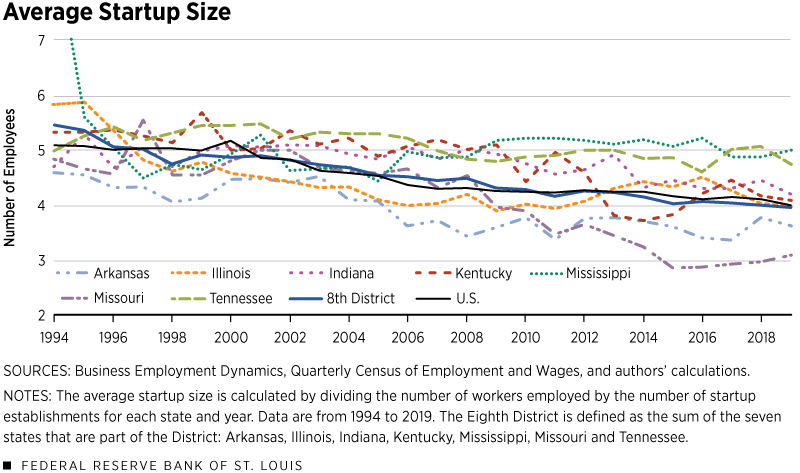
National Trend in Startup Size
It is immediately clear that the average startup size has been steadily declining in the U.S. throughout the sample period. A startup had five employees on average in 1994, but only four in 2019. This might seem small in absolute terms, but average startup size has shrunk by 20% in percentage terms. Interestingly, the decline is linear and smooth, suggesting that this trend was not much affected by booms or busts in the economy.This downward trend in startup size mirrors a similar trend in establishments across the board. Across all firm ages, average establishment size declined from about 16 people in 1994 to 14 people in 2019, though the decline is much less linear.
Eighth District Trend in Startup Size
Figure 1 also plots the average startup size for each of the seven states in the Eighth District and for the District itself. The District average closely follows the national trend. In 1994, startups had a mean size of around 5.5 in 1994, or slightly higher than the national average. Over the sample period, the number converged to the national level at around four employees in 2019.
Eighth District State Trend in Startup Size
Although all seven states making up the District reflected a similar downward trend, there are notable differences in changes of startup sizes. For example, the average number of employees for startups in Tennessee started slightly below five in 1994 and ended at roughly the same level in 2019. However, the average startup in Missouri had around five people in 1994, but only three people in 2019.
These results coincide with the results of our previous study, implying the shrinking startup employment share can at least be partially explained by a decline in startup size.
Startup Size by Industry
Next, we documented the evolution of startup size by industry. The goal was to see whether one particular industry may be leading the decline of startup sizes.The scope of an industry is defined by the North American Industry Classification System.
National Trend in Startup Size by Industry
Figure 2 shows the national average startup size for four representative industries important for the U.S. economy:
- Construction
- Information
- Leisure and hospitality
- Manufacturing
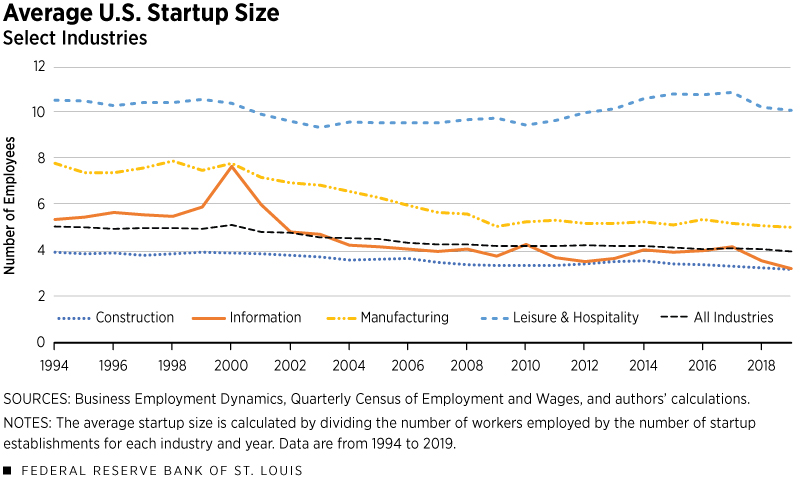
We see that there are sizable differences across industries. Averaged over time, the leisure and hospitality industry had the largest average startup size, at around 10 people per startup. By contrast, manufacturing and information startups had on average six and five workers, respectively, over the sample years. Surprisingly, the construction industry had the smallest startups, with an average size of four.
The differences across these four sectors are probably due to the differences in input intensities. Many tasks in the construction industry can be completed by machines (hence requiring fewer workers), while services in the leisure and hospitality industry tend to be more labor-intensive.
Changes in startup size over time also varied by industry, with the manufacturing and information sectors experiencing the largest changes. The average manufacturing startup had eight employees in 1994, but average startup size nearly halved to five by 2009 and then stayed relatively constant. The information industry had around five employees per startup in 1994, then experienced a spike during the dot-com bubble period, with the average jumping to eight. However, the average quickly fell after the bubble burst and was around three in 2019.
In contrast, the leisure and hospitality industry and the construction industry barely saw changes over our sample, implying that—while there is no clear single industry behind the decline in startup size—some industries have driven the decline more than others.
Eighth District Trend in Startup Size by Industry
Although the numbers seem noisier, a similar pattern appears in the Eighth District, as depicted in Figure 3.
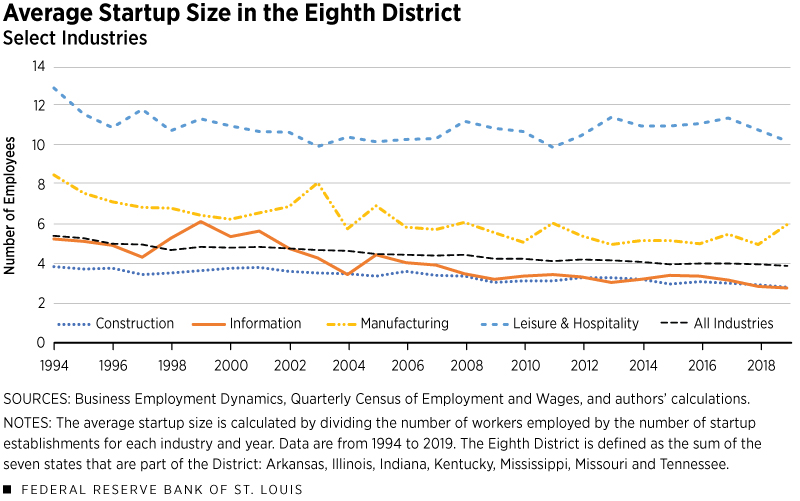
Most notably, the District’s average information startup size was less affected by the dot-com bubble, reflecting similar patterns we noted in our last report on startup employment share.
These results are qualitatively similar to the trends we noted in our last article, though there are industry-specific exceptions. For instance, the leisure and hospitality sector showed a clear decline in startup employment share but no decline in startup size. It is clear that different industries’ decline in startup employment share is driven to different extents by declining startup size and a declining number of startups.
Conclusion
In this article, we documented that startup sizes have been declining. The average number of employees in a startup decreased from five in 1994 to four in 2019, a 20% drop. A similar trend held for the seven states in the Eighth District, with startups in Missouri contracting the most.
Across industries, startups in the information and manufacturing sectors shrank by around 40%, while the construction and the leisure and hospitality sectors did not change much, implying that the overall decline was driven by some industries more than others.
Endnotes
- These seven states are Arkansas, Illinois, Indiana, Kentucky, Mississippi, Missouri and Tennessee. Arkansas is the only state entirely in the Eighth District, with the other states split among districts. Nevertheless, we conduct our analysis on these seven states in total, since we use state-level data.
- “Firm age” is the age of the firm’s oldest establishment, in which “establishment age” is defined as the difference between the current year and the first year the establishment reported positive employment.
- “Firm size” is the number of employees registered under a firm, whether full time or part time and whether temporary or permanent. We specifically looked at “average size,” which is the average of employment in March of the reporting year and employment in March of the previous year. This means that a single individual holding multiple jobs would likely be counted multiple times.
- It is probably more intuitive to think of a “startup” as the new firm itself, and not its establishment(s). However, our sources lack the necessary firm-level data to do so, so we defined “startups” at the establishment level instead. A quick analysis of a related data set (the BED project)—which has both firm-level and establishment-level data—shows that the vast majority of new firms open with only one establishment each, so the two definitions can be viewed as roughly interchangeable.
- This downward trend in startup size mirrors a similar trend in establishments across the board. Across all firm ages, average establishment size declined from about 16 people in 1994 to 14 people in 2019, though the decline is much less linear.
- The scope of an industry is defined by the North American Industry Classification System.


Views expressed in Regional Economist are not necessarily those of the St. Louis Fed or Federal Reserve System.
For the latest insights from our economists and other St. Louis Fed experts, visit On the Economy and subscribe.
Email Us