


Trends in Startups’ Share of Jobs in the U.S. and Eighth District
KEY TAKEAWAYS
- Despite their small size, startups have traditionally been a key source of jobs. Has their role changed in recent years?
- An analysis of firm-level data for the U.S. and the Eighth District indicates that startups have accounted for a shrinking share of all U.S. jobs since 1994.
- This pattern of hiring proportionally fewer workers holds for startups in diverse industries, including construction and information.

In recent years, tech giants have rapidly transformed our lifestyle. We take Uber rides for travel, stay in Airbnb rentals for vacation and search Google for information.
Most of these household names were small firms a decade ago, but these corporations are now big employers in the labor market. In 2019, there were 22,263 employees at Uber, 12,736 at Airbnb, and 114,096 at Google, now a subsidiary of Alphabet.
Startups clearly have the potential to become superstar firms and drive economic growth in the future—and even from the start, startups consistently create more jobs on net than older firms.See, for example, Dvorkin and Gascon. It is obvious, then, that startups have an important role in the current economy. But what does startup activity look like today?
In this article, we provide an overview of startup employment dynamics between 1994 and 2018, which are the earliest and latest years available in our sample. The scope of analysis is comprehensive and does not focus on only tech industries. The study starts at the national level and digs deeper into the seven states that are part of the Federal Reserve’s Eighth District.These seven states are: Arkansas, Illinois, Indiana, Kentucky, Mississippi, Missouri and Tennessee. The Eighth Federal Reserve District, except for Arkansas, overlaps only partially with the political borders of the states; for example, eastern Missouri is included in the District, while western Missouri is not. Nevertheless, we conduct our analysis as if the District comprises these seven states in total, since the data are aggregated at a state level.
We use data from Business Employment Dynamics (BED), a program of the U.S. Bureau of Labor Statistics. The program covers about 97% of all civilian wage and salary employment in the country. The BED data set contains annual net job gains, gross job gains and gross job losses by state, firm industry, firm ageThe age of the firm is the age of the oldest establishment within a firm, in which establishment age is the difference between the reported period and the first time an establishment reported positive employment. and firm size.The firm size is the total employment from all establishments under the same EIN (i.e., owned by the same firm). We analyze by “average size,” which averages employment in March of the reported year with employment in March of the previous year. A firm is a legal business entity issued an Employer Identification Number (EIN) by the IRS, and a startup is a firm less than 1 year old. Numbers of employees are counted based on firm-reported filled jobs, whether full- or part-time and temporary or permanent.A single individual holding multiple jobs could be counted multiple times in the data.
Overall Startup Employment
Figure 1 displays the startup employment share between 1994 and 2018 at various regional levels—the U.S. as a whole, the individual states included in the Eighth District, and the District as a whole.
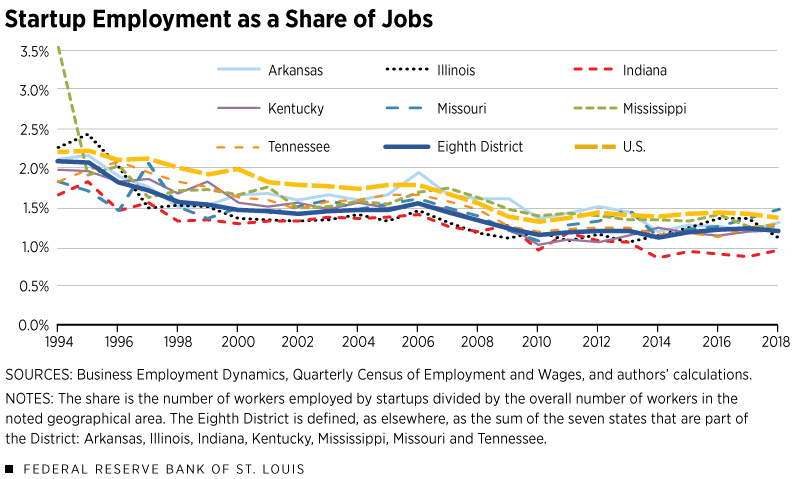
One striking feature of the figure is that the startup employment share has been declining for more than a decade. At the national level, the fraction of employees in startups was 2.2% in 1994 but decreased to 1.4% in 2018. Although the 2007-2009 financial crisis accelerated this decline, the secular trend actually started long before the crisis. On the other hand, post-crisis startup rates have been relatively stable but remain much lower than their historic levels.
A closer look into the Eighth District reveals a similar pattern: The fraction goes from 2.1% in 1994 to 1.2% in 2018. The decline in startup employment share also holds for every District state. Therefore, the decrease in startup employment is not restricted to one specific region, at least in the District.
Startup Employment by Industry
What could be driving the downward trend in startup employment? With the industry-level data, we can examine whether a particular industry is a leading cause. Figure 2 displays the startup employment share by industry as defined by the North American Industry Classification System. Figure 2A depicts the fraction of workers employed by startups in the U.S., while Figure 2B shows the employment share in the District. Instead of presenting results for all industries, we selected the following four representative industries: construction, and leisure and hospitality, whose startups account for high percentages of employment; and information and manufacturing, whose startups account for low percentages.
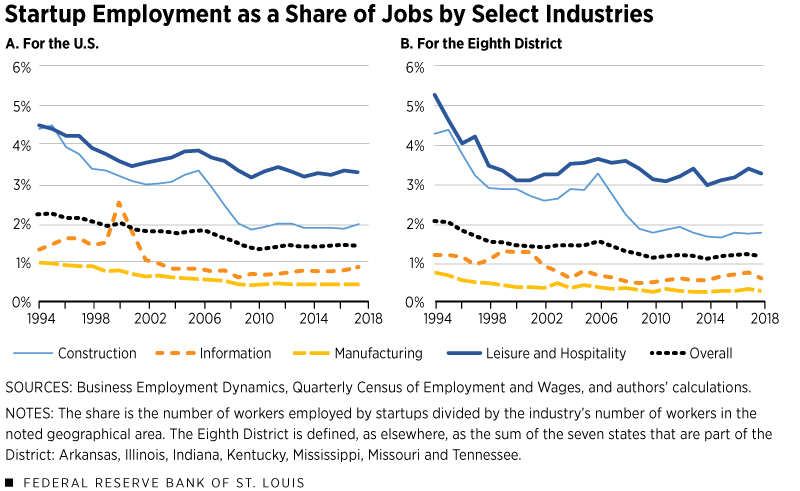
Figure 2A shows that all four U.S. industries experienced shrinkages in startup workforce share, especially industries with high initial startup employment shares. For example, the construction industry nationwide started with 4.4% of workers employed by startups but ended with 1.9%, about a 2.5 percentage point decrease. In contrast, the manufacturing industry's fraction went down only from 1.0% to 0.4%, about a 0.6 percentage point decrease. Although the magnitudes across industries are slightly different, a similar trend also holds at the District level.
Additionally, we see that industries have gone through their own idiosyncratic phases of rises and falls. After the housing bubble burst in 2008, the construction industry experienced large decreases in the fraction of workers in new firms, both at the national and the District level. The bursting of the dot-com bubble in 2000 had a similar impact on the information industry, whose fraction increased during the bubble and was soon followed by a more-than-offsetting decrease.
This pattern is hardly surprising; while recessions affect employment for firms of all sizes and ages, it is well known that smaller and newer firms are hit harder by economic downturns.See, for example, Åžahin et al. The dot com's boom-bust cycle was more evident at the national level than at the District level, possibly because there were fewer information-related firms in the District.
Conclusion
Startups are important for economic growth, but the U.S. startup employment share has declined from 2.2% in 1994 to 1.4% in 2018. While it has stabilized somewhat after the Great Recession, this share remains low by historic standards, and the shrinking began long before the recession. A similar trend holds in all seven states that are part of the Federal Reserve’s Eighth District. We also found that the construction industry and leisure and hospitality industry contributed to the decline more than did the rest of the economy.
Future research should study why startups in these sectors are employing proportionally fewer workers. While the BED data show a decline in absolute startup employment similar to the decline we note above, for instance, they do not explain the entire drop in the share of jobs, opening questions both about a decline in startups and about a change in employment dynamics among aging firms that must be explained.
Endnotes
- See, for example, Dvorkin and Gascon.
- These seven states are: Arkansas, Illinois, Indiana, Kentucky, Mississippi, Missouri and Tennessee. The Eighth Federal Reserve District, except for Arkansas, overlaps only partially with the political borders of the states; for example, eastern Missouri is included in the District, while western Missouri is not. Nevertheless, we conduct our analysis as if the District comprises these seven states in total, since the data are aggregated at a state level.
- The age of the firm is the age of the oldest establishment within a firm, in which establishment age is the difference between the reported period and the first time an establishment reported positive employment.
- The firm size is the total employment from all establishments under the same EIN (i.e., owned by the same firm). We analyze by “average size,” which averages employment in March of the reported year with employment in March of the previous year.
- A single individual holding multiple jobs could be counted multiple times in the data.
- See, for example, Åžahin et al.
References
Dvorkin, Maximiliano; and Gascon, Charles. “Startups Create Many Jobs, but They Often Don’t Last.” Regional Economist, Third Quarter 2017, Vol. 25, No. 3, pp. 21-2. See stlouisfed.org/publications/regional-economist/third-quarter-2017/startups-create-many-jobs-but-they-often-dont-last.
Åžahin, AyÅŸegül; Kitao, Sagiri; Cororaton, Anna; and Laiu, Sergiu. “Why Small Businesses Were Hit Harder by the Recent Recession.” Federal Reserve Bank of New York Current Issues in Economics and Finance, 2011, Vol. 17, No. 4.


Views expressed in Regional Economist are not necessarily those of the St. Louis Fed or Federal Reserve System.
For the latest insights from our economists and other St. Louis Fed experts, visit On the Economy and subscribe.
Email Us