


Better than Ever? The Wealth of Retired Households
KEY TAKEAWAYS
- An analysis of U.S. data shows that the average retired household in 2016 had greater wealth than those in 2001 and 1989.
- Though wealth inequality has worsened, increased median wealth among current retired households indicates most retirees are benefiting from economic growth.
- Economic growth has allowed the most recent retirees to grow their nest eggs, though they may face eroding purchasing power due to rising medical costs.

How financially fit are U.S. retirees? How has their financial position evolved over time? There has been a growing interest in these issues as aging baby boomers continue to retire. Some argue that the retirement situation is mixed for Americans, with many approaching retirement age with little or no retirement savings.See Chien and Morris.
This article offers a glimpse into the state of current retirees’ household wealth compared with that of past retirees. To see how current retirees fare relative to previous cohorts, we compared the balance sheets of households headed by retirees in 2016 with those of households headed by retirees in 2001 and 1989.Retirees are defined as those survey households whose heads are 65 years or older in the survey year. We analyzed the composition of their assets and liabilities using household-level data from the Survey of Consumer Finances (SCF).The survey provides cross-sectional data on U.S. households’ demographic characteristics, incomes, balance sheets and pensions every three years. The results reported in this article should represent the general state of the asset and liability positions of retired households.
Overall, our analysis indicates that the average value of asset holdings among retirees has more than doubled between 1989 and 2016 after adjusting for inflation. An increase in both financial assets, such as stocks and bonds, and nonfinancial assets, such as housing, contributed to the rise in assets among retirees. In terms of liabilities, retirees in 2016 were slightly more indebted on average than retirees in 1989, primarily due to larger holdings of mortgage debt.
U.S. economic growth has mainly driven this rise in wealth among retirees, which has also improved their standard of living. Moreover, inequality—as measured by the ratio between average and median total assets—has worsened over time although only slightly, suggesting that the majority of retirees still benefit from rising wealth resulting from economic growth.
Doubling Assets
The average value of total assets grew significantly among retirees from 1989 to 2016. As shown in Figure 1, retirees in 2016 held an average of $1.12 million worth of assets, while retirees in 1989 and 2001 held an average of $520,000 and $806,000 worth of assets, respectively.Note that all dollar numbers are inflation-adjusted to 2016 dollars and therefore can be compared directly. In this article, dollar amounts of $20,000 and greater have been rounded to the nearest $1,000. In other words, retirees’ assets more than doubled from 1989 to 2016.
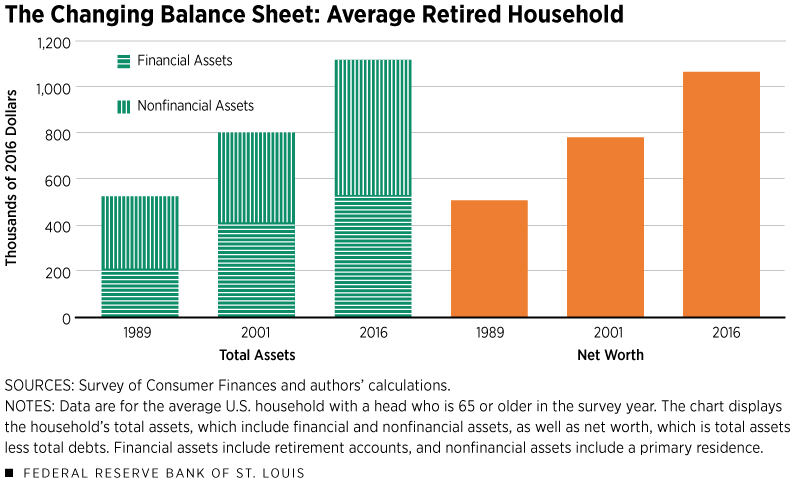
This rise was driven by both financial and nonfinancial assets.In the SCF data, the total household assets include the value of retirement accounts, which cover both defined-benefit (DB) pension plans and defined-contribution (DC) retirement plans. The significant shift of retirement plans from DB to DC (observed since 1980) should not affect our results. The value of retirees’ financial assets grew from $217,000 in 1989, to $399,000 in 2001 and then to $538,000 in 2016. This means that the average financial asset position in 2016 was around $321,000 higher than in 1989 and $139,000 higher than in 2001. The rise of nonfinancial assets followed a similar pattern, increasing by $280,000 from 1989 to 2016 and by $175,000 from 2001 to 2016.
In terms of liabilities, 2016 retirees were also slightly more indebted on average than previous generations of retirees because of higher holdings of mortgage debt. The value of debt among retirees grew from $11,000 in 1989, to $24,000 in 2001 and then to $51,000 in 2016 (not shown in Figure 1). However, the size of debt was relatively small compared to the size of assets.
Overall, we see that the average size of assets among retirees grew significantly over time, while the size of debt rose only slightly; thus, liabilities remained a smaller share of retirees’ total assets. Ultimately, we see a considerable rise in average net worth among retirees, from $509,000 in 1989, to $782,000 in 2001 and to more than $1 million in 2016.
Long-term U.S. economic growth mostly drove this substantial increase in retirees’ wealth. As the economy grows, aggregate assets accumulate over time, resulting in higher output and welfare. Retirees were not the only ones to benefit from economic growth, as the total population’s average asset position nearly doubled during our sample period. Nevertheless, note that the value of assets more than doubled among retirees while only nearly doubling for the population as a whole. This implies that retirees’ assets grew faster than the average, and that the rest of the population experienced slower asset growth.
Inequality Concern
Rising average wealth among retirees may not necessarily benefit everyone. As documented by economists Emmanuel Saez and Gabriel Zucman, wealth inequality is very significant in the U.S. and has worsened in recent decades. If wealth inequality among retirees also worsens over time, then wealth becomes more concentrated among a smaller fraction of retirees, which may prevent the majority of retirees from enjoying the benefits of economic growth.
To shed light on this issue, we calculated the median—instead of the average—of retirees’ assets, liabilities and net worth over time. The results for assets and net worth are reported in Figure 2.
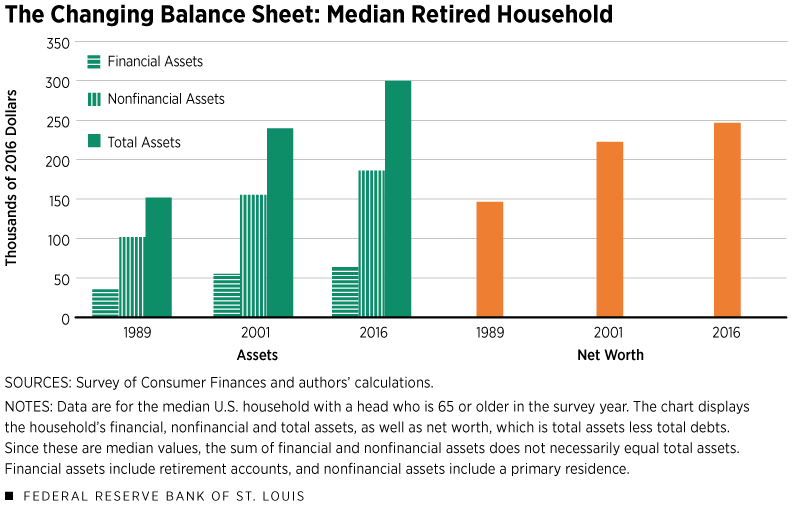
Median total assets among retirees also grew substantially, from $151,000 in 1989, to $240,000 in 2001 and to $301,000 in 2016. The median retiree held little to no debt throughout our sample period. Therefore, median net worth increased substantially from $145,000 in 1989 to $246,000 in 2016.
The increase in median total assets and net worth was large but still smaller than the rise in average assets and net worth reported in Figure 1. The slower increase in the median relative to the average indicates that wealth inequality worsened. Despite worsening wealth inequality, however, the large increase in median total assets signifies that the majority of retirees still benefit greatly from the increasing wealth induced by long-term economic growth.However, most of the increase may be due to homeowner’s equity, which retirees could not easily use to cover living expenses.
The Power of Economic Growth
The average and median inflation-adjusted wealth of retirees has been increasing over time. The rise is driven mostly by long-term economic growth. This is good news for future retirees, especially because Social Security taxes collected may someday be insufficient to pay the scheduled benefits. Our analysis demonstrates that economic growth can help alleviate retirement concerns by growing retirees’ nest eggs.
The higher level of inflation-adjusted wealth should enable current retirees to improve their standard of living compared with that of previous cohorts of retirees. However, this conclusion is subject to a caveat: Retirees may face a higher-than-average inflation rate since their consumption tilts toward medical services, which have exhibited a faster pace of inflation in the past two decades. This could erode the purchasing power of their increasing wealth.
Endnotes
- See Chien and Morris.
- Retirees are defined as those survey households whose heads are 65 years or older in the survey year.
- The survey provides cross-sectional data on U.S. households’ demographic characteristics, incomes, balance sheets and pensions every three years. The results reported in this article should represent the general state of the asset and liability positions of retired households.
- Note that all dollar numbers are inflation-adjusted to 2016 dollars and therefore can be compared directly. In this article, dollar amounts of $20,000 and greater have been rounded to the nearest $1,000.
- In the SCF data, the total household assets include the value of retirement accounts, which cover both defined benefit (DB) pension plans and defined contribution (DC) retirement plans. The significant shift of retirement plans from DB to DC (observed since 1980) should not affect our results.
- However, most of the increase may be due to homeowner’s equity, which retirees could not easily use to cover living expenses.
References
Saez, Emmanuel; and Zucman, Gabriel. “Wealth Inequality in the United States since 1913: Evidence from Capitalized Income Tax Data.” The Quarterly Journal of Economics, May 2016, Vol. 131, No. 2, pp. 519-78.


Views expressed in Regional Economist are not necessarily those of the St. Louis Fed or Federal Reserve System.
For the latest insights from our economists and other St. Louis Fed experts, visit On the Economy and subscribe.
Email Us