St. Louis Fed Steps in to Provide More-Timely Jobs Data
KEY TAKEAWAYS
- Bureau of Labor Statistics revises state and local employment data just once a year.
- The St. Louis Fed analyzes the data and reports on it four times a year.
- This extra reporting can take the surprise out of a once-a-year revision.

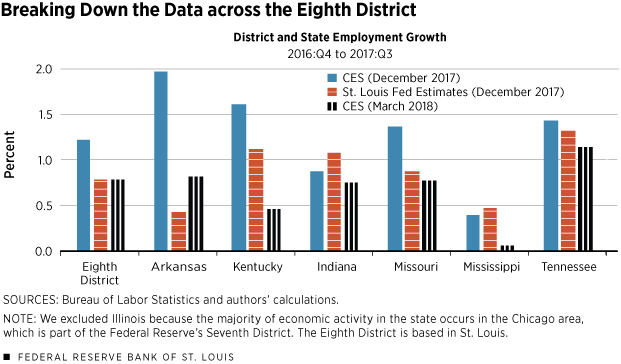
On March 12, the U.S. Bureau of Labor Statistics (BLS) released its annual revision to its monthly state and local employment data. The latest revision shows weaker growth across the Federal Reserve’s Eighth District (based in St. Louis) than initially reported.The Eighth Federal Reserve District covers all or parts of Arkansas, Illinois, Indiana, Kentucky, Mississippi, Missouri and Tennessee. For example, growth from the fourth quarter of 2016 to the third quarter of 2017 in Arkansas was revised down from 2 percent to 0.8 percent; for another example, Kentucky’s growth was revised down from 1.6 percent to 0.5 percent.
Although these revisions were significant, they didn’t come as a surprise to us at the St. Louis Fed. We have been releasing our own estimates of regional employment growth since mid-2017, and they have generally matched up well with the revisions released every March by the BLS. Our estimates can alert policymakers of likely revisions well ahead of time, allowing them to make decisions based on information that is often more accurate than the initial releases from the BLS.
The BLS uses its Current Employment Statistics (CES) program to produce monthly estimates of nonfarm payroll employment. Once a year, it revises these figures, relying largely on data from its Quarterly Census of Employment and Wages (QCEW) program. Rather than wait for the annual revision, we have been producing our own quarterly job figures based on the most recent QCEW data. Back in December, we released our estimates that showed weaker employment growth across the Eighth District than was being reported by the BLS at the time.See Gascon and Morris.
Predictable Data Revisions
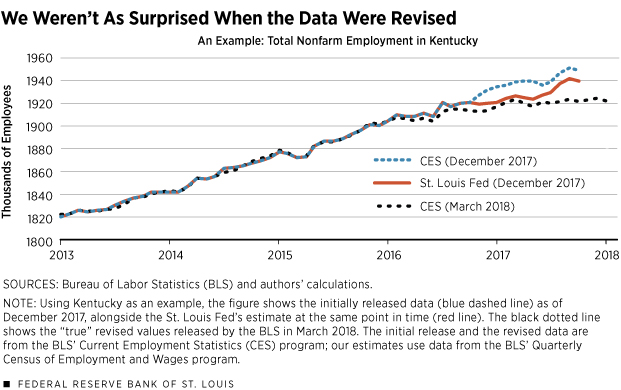
Figure 1 plots time series of the initially reported BLS data as of early December for Kentucky, along with our estimates and the revised data released in March by the BLS. Our estimates provide us with more up-to-date information on the expected direction and magnitude of the revision in a particular area. In December, we expected the BLS to revise the initial CES release down from year-over-year growth of 1.6 percent to 1.1 percent. In March, the BLS revised growth down to 0.5 percent. While we were not expecting such a large revision, our estimates correctly indicated a downward revision and were closer to the revised CES data than was the BLS release available in December.
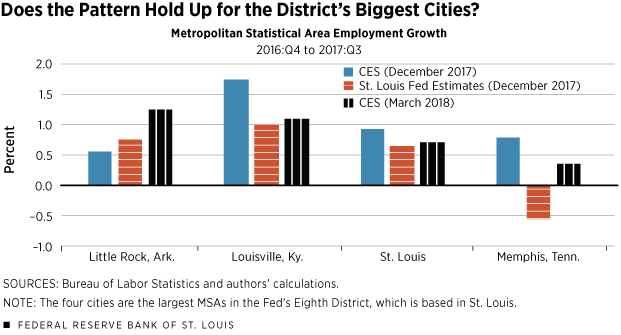
Figures 2 and 3 report year-over-year growth for the states and four largest metropolitan statistical areas (MSAs) in the Eighth District. We excluded Illinois because the majority of economic activity in the state occurs in the Chicago area, which is part of the Federal Reserve’s Seventh District. The BLS revised employment growth down in every state and in each of the four largest MSAs with the exception of Little Rock, Ark. In addition to capturing the single upward revision, our December estimates correctly predicted downward revisions across most of the Eighth District. The exceptions were Indiana, where the BLS’ revision was negligible, and Mississippi.
One way to think of the initial release of employment data is as an estimate of the “true” value that will be released in March, similar to our estimate produced at the same time. You can see that our estimates are much closer to the values released in March, on average.We use prediction error as our performance metric, which we define to be the absolute value of the difference between the growth rates of the initial release or estimate and the revised data. The average error of the initially reported CES data was 0.6 percent; our error was half that, or 0.3 percent. Our estimates improved upon the initial release in four of the six states and three of the four MSAs.
In addition to improving upon the initially reported data in Kentucky, our estimates performed well in Arkansas. While our estimates overshot the downward revision, we brought the prediction error down to 0.4 percent from an initially reported 1.1 percent.
Memphis was a unique case. Our estimates suggested a steep downward revision. The direction of the revision was correctly predicted but was of a much smaller magnitude than anticipated, resulting in a larger prediction error.
Decisions Based on Early Data: Be Careful
Analyzing initially reported employment data can lead to incorrect conclusions when significant revisions occur, as we saw in Arkansas and Kentucky. Thus, an awareness of the expected revisions is important.
Revisions can occur for a variety of reasons, including: sample size may be small, new firms may not complete the BLS surveys when the firms are initially formed (leading to understating employment) and closing firms may not respond (leading to overstating employment).
While our December estimates do not perfectly match up with the BLS’ revisions, ours serve as useful indicators of where we might expect employment growth to be when March arrives. Continue to check back, as we intend on releasing our employment estimates regularly in the future.
Calculating Our Estimates
We use a process developed at the Dallas Fed known as early benchmarking.For more information on the early benchmarking process, see the Federal Reserve Bank of Dallas. It uses the same administrative data that the BLS uses for its annual benchmark revision.
Around the 20th of each month, the BLS releases estimates of state and local employment for the previous month produced from its CES survey. This is a voluntary survey of businesses and samples about 7 percent of establishments. The BLS relies heavily on its QCEW data for its revision, which is less timely but is collected from all establishments with employees covered by unemployment insurance. Because the BLS releases QCEW data with a six-month lag but only benchmarks in March, we have been able to produce early estimates of revised state and local employment after each release of the QCEW.
Keep Up with ALFRED
The BLS’ revised employment data for states, MSAs and industries across the nation far exceed the scope of the estimates that we produce. Fortunately, you can examine how the revisions changed the story of employment growth in a particular region using archived data. The St. Louis Fed maintains records of data revisions in its ALFRED (ArchivaL Federal Reserve Economic Data) database, which allows you to retrieve vintage versions of data that were available on specific dates in history. This means that you can compare initial releases with revised data for any of the nonfarm payroll series available in FRED (Federal Reserve Economic Data, which is our signature database).
Step by Step Instructions, Using Missouri as an Example
To produce a line graph showing year-over-year growth rates of the data before and after the revision for a particular state or MSA, follow the procedure we outline below for the state of Missouri.
- Start at the GeoFRED map of total nonfarm employment for states (http://geof.red/m/9m7). A corresponding map for MSAs is also available (http://geof.red/m/9m6).
- Access the FRED page containing nonfarm payroll data for Missouri by clicking on the state. Then select the Details and Data tab and follow the link directly under the tab you just clicked.
- Click on ALFRED Vintage Series in the Related Content section underneath the chart to access the series in the ALFRED database.
- Click on the Edit Graph button. Under the Format tab, change the graph type from bar to line.
- Click on Edit Lines, select either Line 1 or Line 2, and change the units to Percent Change from Year Ago and copy to all.
- Remain under the Edit Lines tab. Select vintage date "2018-03-12" for Line 1 and "2018-01-23" for Line 2, respectively.
- Select a starting date for the graph dating back to at least the beginning of 2016. This ensures that the entirety of the BLS’ revision period is visible.
The final line graph is available at https://alfred.stlouisfed.org/graph/?g=jXjb.
Endnotes
- The Eighth Federal Reserve District covers all or parts of Arkansas, Illinois, Indiana, Kentucky, Mississippi, Missouri and Tennessee.
- See Gascon and Morris.
- We use prediction error as our performance metric, which we define to be the absolute value of the difference between the growth rates of the initial release or estimate and the revised data.
- For more information on the early benchmarking process, see the Federal Reserve Bank of Dallas.
References
Gascon, Charles; and Morris, Paul. Employment Growth in the Eighth District Appears Weaker Than Currently Reported. On the Economy (a blog), Dec. 21, 2017. See https://www.stlouisfed.org/on-the-economy/2017/december/employment-growth-eighth-district-appears-weaker-currently-reported.
Federal Reserve Bank of Dallas. Early Benchmarking: How Early Benchmarking Improves the Accuracy of Payroll Employment Data. DataBasics. See https://www.dallasfed.org/research/basics/benchmark.aspx.
Views expressed in Regional Economist are not necessarily those of the St. Louis Fed or Federal Reserve System.
For the latest insights from our economists and other St. Louis Fed experts, visit On the Economy and subscribe.
Email Us


