Hispanics and Their Contribution to America’s Human Capital
KEY TAKEAWAYS
- Hispanics are a growing share of the U.S. workforce. Yet they are more likely to work in lower-skill occupations than non-Hispanics.
- Data show that the education level of Hispanic workers lags behind that of non-Hispanic workers. This may explain the disparity in occupations.
- The country’s aggregate productivity would improve if Hispanics could develop their talent and skills.

Immigrants and native-born Americans. Farmworkers and professionals. High school graduates and doctors. With backgrounds from Mexico to Chile. Much of this diversity is often ignored in the frequent discussion of the ever-rising weight of Hispanics in both the U.S. population and labor force. But the composition of the Hispanic population and labor force has been changing, in some areas dramatically, and a deeper understanding of these changes is needed to assess the contribution of Hispanics to the country’s overall human capital.
In this article, we explore the transformation in the human capital of Hispanics and how these shifts have impacted their occupations and integration into the American workplace. We describe not only the substantial increase in the numbers but also the significant diversity and assimilation of Hispanic workers in the U.S., how they compare with their peers in terms of education, and their participation in different occupations. We also put emphasis on the presence of Hispanics in the higher-earning occupations and describe the increased role of Hispanic women in those occupations.
Our review of the data helps us elucidate and discuss some of the key challenges faced by the Hispanic population—if they are to fully assimilate and catch up with their peers in the U.S. labor force.
The Growing Hispanic Presence
We collected individual level-data on the age, gender, race, education level and current occupation of workers from a data set, IPUMS USA.See IPUMS USA, University of Minnesota, www.ipums. We discard individuals whose employment status is unknown, and those who are unemployed or not in the labor force, as classified by the variable EMPSTAT codes 0, 2 and 3. For simplicity, we grouped workers into two bins: Hispanics and non-Hispanics, according to their self-reported characterization. From these data, we found that the percentage of U.S. residents who identify themselves as Hispanic or Latino have grown dramatically—more than eight times—within the last seven decades. Hispanics represented a mere 1.9 percent of the population in 1950, compared to almost 16 percent in 2016.
The fastest growth is between 1970 and 2000, when the percentage more than tripled—from 4 percent in 1970 to 12.3 percent in 2000. After 2000, the growth has remained substantial, but has been much slower. Very similar numbers hold when we restrict attention to the working-age population. As with the overall population, the percentage of Hispanic workers grew by a factor greater than eight, from barely being just 1.6 percent (1 in 63) in 1950 to being 13.4 percent (1 in 7.5) in 2016.
The IPUMS USA database can be used to classify workers according to 11 educational attainment categories. For tractability, we grouped these categories into five broader groups: primary school or less (nursery school through eighth grade), secondary incomplete (ninth to 11th grade), secondary complete (12th grade), college incomplete (one to three years of college), and college complete or more (four or more years of higher education).
The data set also allows us to group workers according to broad occupational groups. Specifically, IPUMS USA uses the 1950 Census Bureau occupational classification, aggregating three-digit occupations into the following nine broad groups, ordered by their skill intensity:Skill intensity is measured by the percentage of workers in an occupation with the highest year of school degree completed in 1950 being college or more. Thus, the higher the percentage of workers in an occupation with at least a college degree in 1950, the more skill-intensive an occupation is. The order of the top four occupations is preserved if we use 2016 instead of 1950 to measure skill intensity. professional and technical workers; managers, officials and proprietors; sales workers; clerical and kindred; craftsmen; service workers; operatives; farmers and farm laborers; and unskilled laborers.Observations of individuals with unclassified, missing or unknown occupations are discarded.
Hispanic Workers across Occupations
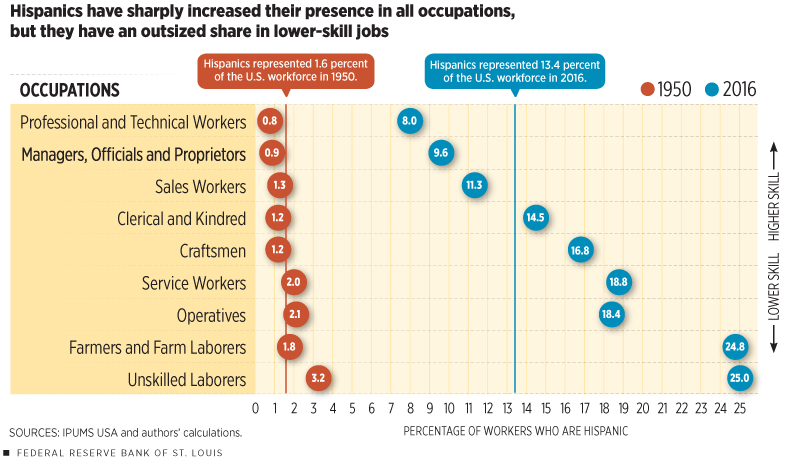
We start by exploring the changes in what the Hispanic-American workers do in the marketplace. First of all, the presence of Hispanic workers has grown in all occupations. For each of the nine occupations available in IPUMS USA, Figure 1 shows the percentage of workers who identify themselves as Hispanic. In all the categories, the growth has been substantial—in some cases by much more than a tenfold growth in the participation of Hispanics—including in the highest paid occupations, i.e., professionals and managers, which we discuss further below.
A second key finding that is evident from Figure 1 is that the growth in the Hispanic participation across occupations has been far from uniform. Instead, it has been substantially inclined toward lower-skill jobs. Indeed, as of 2016, the participation of Hispanics in occupations such as service workers, operatives and, most strongly, farmworkers and unskilled laborers is much higher than their weight in the population and labor force. By contrast, the participation of Hispanics in professional occupations and managerial occupations and, to a lesser extent, sales occupations is substantially lower than in the aggregate of all occupations.
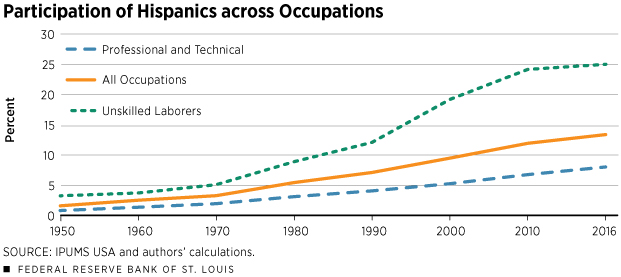
Figure 2 further illustrates these asymmetries, displaying the fraction of Hispanics in the occupations ranked top and bottom in terms of skills (i.e., professional and technical, and unskilled laborers), along with the overall Hispanic presence in the labor force.
The figure shows that these disparities not only are non-negligible but also have been growing over time. Accelerating first in 1970, when the Hispanic presence was growing the fastest, these disparities have increased even faster since 1990, when the Hispanic population growth was starting to slow down.
The end result of these asymmetric growth rates is that, for 2016, the last year in our sample, Hispanics were only 8 percent of professional workers, who are employed in highly paid occupations, while they accounted for 25 percent of unskilled laborers, which are occupations with much lower earnings.
The Education Effect
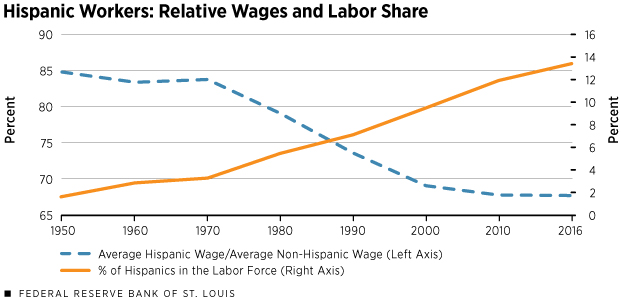
A number of obvious questions arise. The first one is the following: How does much of the growth directed toward lower-skill occupations translate into wages? It turns out quite a bit! In Figure 3, we display the behavior of the average wages of Hispanic workers relative to the wages of non-Hispanics. The figure clearly shows that the average wages of Hispanic workers have been substantially lower than those of non-Hispanic workers during the entire sample period. More interestingly, the figure also shows that this ratio has fallen substantially with the rise in the share of Hispanic workers, most notably from 1970 to 2000, precisely when the population of Hispanics grew the fastest in the U.S. For the later years, the ratio has settled to around two-thirds of the average wage for non-Hispanic workers.
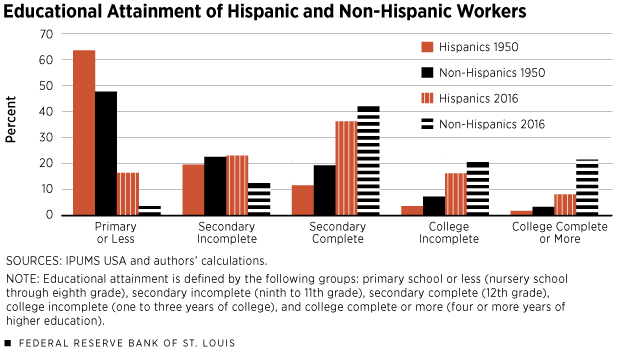
The next obvious question is: What explains these large gaps? Education and skill formation in general is the No. 1 candidate for the driver. Indeed, Figure 4 shows the distribution of workers across levels of educational attainment for U.S. Hispanic workers (red) and non-Hispanic workers (black) for both 1950 and 2016. Each bar represents the percentage of the workers, Hispanics and non-Hispanics, in each education group.
We must first recognize the substantial progress in the educational attainment of both groups of workers. The most dramatic improvement can be seen in the drastic reduction of the population with primary education or less: While 63.5 percent of the Hispanic workers in 1950 had primary education as their highest level attained, this percentage plunged to only 16.4 percent in 2016. On the other extreme, the fraction of Hispanic workers with some college moved from 3.6 percent to 16.2 percent, while those who have at least completed college surged from 1.8 percent to 8.1 percent.
While substantial, the improvements in the schooling attainment of Hispanic workers are far from enough to catch them up with their non-Hispanic peers. Indeed, from 1950 to 2016, the fraction of non-Hispanics with no more than a primary education collapsed from 47.7 percent to just 3.6 percent. The fraction of non-Hispanics with some college surged from 7.2 percent to 20.6 percent, while the fraction with college completed or more jumped from 3.3 percent to 21.5 percent.
The Hispanic education gap can explain the lower earnings for two different reasons. First, as shown in Figures 1 and 2, workers with lower levels of schooling are more likely to end up in lower-skill occupations.
This form of assignment is simply driven by comparative advantage: Despite having lower productivity in absolute terms in all occupations, lower-education workers are relatively more productive in lower-skill occupations. By contrast, workers with a higher level of education may be more productive in all occupations, but their productivity would be relatively higher in higher-skilled occupations.
In these cases, the assignment of workers to jobs and occupations would exhibit positive sorting: Highly skilled workers would be assigned in higher proportions to higher-skilled occupations, and less-skilled workers would be assigned in higher proportions to lower-skill occupations. The IPUMS USA data clearly indicate that because of the group’s lower educational attainment, Hispanic workers in the U.S. have comparative advantage in those lower-skill occupations, as revealed by their underrepresentation in higher-skilled occupations (professionals, managers) and by their overrepresentation in lower-skill occupations.
The second mechanism by which education could explain why Hispanic workers earn less than their non-Hispanic peers would be that, despite both being in the same occupation, they earn less because of their inferior training and lower skills. That is, education determines not only the assignment of workers to an occupation but also their absolute advantage in each occupation.
We explored this second mechanism, using the same IPUMS USA data to control for the impact of observable factors such as age, education, gender and experience on the income of workers.This is what is known in the literature as “Mincer” regressions. Once we controlled for the other observable factors, we found that the earnings of Hispanics and non-Hispanics were fairly similar, even in the highest-earning occupations. Indeed, some gaps between Hispanics and non-Hispanics persisted after controlling for age and education, but the magnitude of those gaps was too small to account for much of the observed differences in the raw data.
In sum, the education gap of Hispanic workers relative to their peers in the U.S. labor force is the key candidate factor driving the gaps in the occupations and earnings. The key question is: Why does the education level of Hispanics lag behind? Can this gap be accounted for by intergenerational persistence, given the fact that it may take a while for children of poorly educated immigrants to catch up with the rest of the population? In any event, policies aiming to improve the standing of Hispanics in the U.S. labor markets—and in general—are likely to fail unless they address the lower educational attainment of that population.
Gender Differences
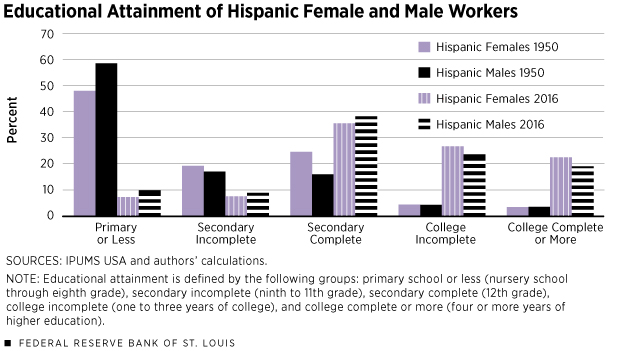
We finish our exploration of the Hispanic labor force by looking at the evolution of gender differences over time. Figure 5 decomposes the educational attainment of Hispanics, showing separately the educational attainment of female and male workers in 1950 and 2016. The solid bars are for the year 1950, and the striped bars are for 2016. The lavender and black bars represent females and males, respectively.
The first fact observed in the figure is that both males and females have advanced substantially. In 1950, less than one-tenth of workers in both genders had at least some college education. By 2016, more than 40 percent of workers in both genders had at least some college education.
The second clear fact is that in both periods—and over the entire sample period—the educational attainment of Hispanic women is higher than the educational attainment of men. Indeed, men outnumber women in the groups of workers with an education in the lower categories: primary or less, secondary incomplete and secondary complete. Meanwhile, women outnumber men in the upper categories: college incomplete and college complete or more.
Can this gap between female and male Hispanic workers explain differences in their labor market experience? A formal answer is outside the focus of this article, but it will be the focus for an article in an upcoming issue of the Regional Economist. But a hint can be provided here: The data show that since 1980, female Hispanic workers have overtaken their male counterparts in professional and technical occupations. As of 2016, about 1 in 20 Hispanic female workers were professionals compared to only 1 in 30 for the males. This trend is in line with the observed evolution for the overall population, as we detailed in our previous article in the Regional Economist.See Monge-Naranjo and Vizcaino, 2017.
Conclusions
In this article, we explored the substantial shifts in the participation of Hispanic workers in the American labor force since 1950. We show that the presence of Hispanic workers has increased dramatically over these years, more than eight times. We also documented that the presence of Hispanics has increased in all occupations. However, we found big differences in their expansion across the different occupations.
In particular, we found that Hispanic workers are assigned in higher proportions to lower-skill occupations. To explain these findings, we argue that the education of Hispanic workers lags behind that of non-Hispanic workers, so the observed pattern is consistent with recent assignment models, in which workers choose occupations on the basis of their comparative advantage (e.g., Costinot and Vogel).See Costinot and Vogel.
The data suggest that the observed disadvantages of Hispanic workers in the U.S. labor markets do not seem to be the result of labor market frictions, e.g., sheer discrimination or lack of information. Once we control for education, age and gender differences, the Hispanic/non-Hispanic gaps mostly disappear. Instead, the factor holding back Hispanic workers in the U.S. seems to be their educational attainment.
To be sure, progress has been made there, but the Hispanic population is still lagging behind the rest of workers. Regardless of the reason why Hispanics remain behind, the aggregate productivity of the country would improve if that source of talent and skills is fully developed and exploited.This point is forcefully made by Hsieh et al.
Finally, we found that women have advanced at a faster pace than men have. The patterns for Hispanic females are in line with the findings for all the workers in general.See Rendall.
At the time this was written, Juan Ignacio Vizcaino was a technical research associate at the Federal Reserve Bank of St. Louis. He is currently a Ph.D. student in economics at Washington University in St. Louis. Research assistance was provided by Hee Sung Kim, a senior research associate, and Qiuhan Sun, a research associate, both at the Federal Reserve Bank of St. Louis.
Endnotes
- See IPUMS USA, University of Minnesota, www.ipums.org. We discard individuals whose employment status is unknown, and those who are unemployed or not in the labor force, as classified by the variable EMPSTAT codes 0, 2 and 3.
- Skill intensity is measured by the percentage of workers in an occupation with the highest year of school degree completed in 1950 being college or more. Thus, the higher the percentage of workers in an occupation with at least a college degree in 1950, the more skill-intensive an occupation is. The order of the top four occupations is preserved if we use 2016 instead of 1950 to measure skill intensity.
- Observations of individuals with unclassified, missing or unknown occupations are discarded.
- This is what is known in the literature as “Mincer” regressions.
- See Monge-Naranjo and Vizcaino, 2017.
- See Costinot and Vogel.
- This point is forcefully made by Hsieh et al.
- See Rendall.
References
Costinot, Arnaud; and Vogel, Jonathan. Matching and Inequality in the World Economy. Journal of Political Economy, Vol. 118, No. 4, 2010, pp. 747-86.
Hsieh, Chang-Tai; Hurst, Erik; Jones, Charles I.; and Klenow, Peter J. The Allocation of Talent and U.S. Economic Growth. Unpublished manuscript, 2018. See http://klenow.com/HHJK.pdf.
Monge-Naranjo, Alexander; and Vizcaino, Juan Ignacio. Shifting Times: The Evolution of the American Workplace. Regional Economist, Fourth Quarter 2017, Vol. 25, No. 4, pp. 4-9.
Rendall, Michelle. Brain versus Brawn: The Realization of Women’s Comparative Advantage. Unpublished manuscript, 2018. See https://sites.google.com/site/mtrendall/research.
Ruggles, Steven; Genadek, Katie; Goeken, Ronald; Grover, Josiah; and Sobek, Matthew. Integrated Public Use Microdata Series [IPUMS] USA: Version 6.0 [data set]. Minneapolis: University of Minnesota, 2015. http://doi.org/10.18128/D010.V6.0.
Views expressed in Regional Economist are not necessarily those of the St. Louis Fed or Federal Reserve System.
For the latest insights from our economists and other St. Louis Fed experts, visit On the Economy and subscribe.
Email Us


