


Shifting Times: The Evolution of the American Workplace
What are the main characteristics of American workers? What types of jobs do they do? Who does what? It turns out that the answers to these questions have been changing, in some cases dramatically.
For starters, the basic demographic makeup—age, gender and race—is very different now than it was nearly 70 years ago. Second, the educational levels of workers have been increasing dramatically.1 Third, the occupations or types of jobs employing American workers are very different now relative to what American workers were doing just a few decades ago.
In this article, we explore these shifts in the American labor force and workplace. We show that the identity, education and occupations of the average American worker have all been changing. We also show that there are big changes in who does what, especially in the higher-skilled and higher-paying occupations.
Overall, the picture emerging from the data is very clear: American workers are older, more educated and more diverse. Because skilled workers are more abundant, the employment opportunities have been shifting to higher-skilled occupations, and this movement has taken place for workers of all genders and races. Workers with lower- or even middle-level skills are likely to face relatively tougher times because their remaining labor market opportunities are in the lower-skilled occupations.
Demographics and Education
To characterize American workers over the years, we collected individual level data from IPUMS-USA on the age, gender, race, educational level and current occupation of workers.2 For ease of use, we categorized the nine racial groups in the database into four broader groups: white, black, Asian and other.3 Similarly, for educational levels, we grouped the 11 categories in the data into five broader groups representing the maximum possible level of education attained by these individuals: primary or less (nursery through grade 8), secondary incomplete (grades 9-11), secondary complete (grade 12), college incomplete (one to three years of college), and college complete or more (four or more years of college).
Characteristics of American Workers: 1950-2015
| Year | Average Age | Gender | Race | Education | ||||||||
|---|---|---|---|---|---|---|---|---|---|---|---|---|
| Male | Female | White | Black | Asian | Other | Primary or Less | Secondary Incomplete | Secondary Complete | College Incomplete | College Complete or More | ||
| 1950 | 37.7 | 72.6% | 27.4% | 90.0% | 9.6% | 0.3% | 0.2% | 38.8% | 19.3% | 24.3% | 9.3% | 8.4% |
| 1960 | 40.1 | 68.0% | 32.0% | 89.8% | 9.3% | 0.6% | 0.3% | 29.4% | 22.3% | 28.4% | 10.4% | 9.6% |
| 1970 | 39.3 | 62.9% | 37.1% | 89.2% | 9.5% | 0.8% | 0.4% | 17.3% | 21.0% | 35.4% | 13.4% | 12.8% |
| 1980 | 37.4 | 57.8% | 42.2% | 87.7% | 9.7% | 1.8% | 0.8% | 8.3% | 15.4% | 38.4% | 19.3% | 18.6% |
| 1990 | 38.3 | 54.7% | 45.3% | 83.1% | 10.0% | 2.9% | 4.0% | 3.8% | 9.2% | 33.2% | 45.5% | 8.2% |
| 2000 | 40.0 | 53.6% | 46.4% | 78.8% | 10.1% | 3.8% | 7.3% | 2.9% | 7.7% | 38.1% | 41.6% | 9.7% |
| 2010 | 43.1 | 52.3% | 47.7% | 76.8% | 10.8% | 5.3% | 7.1% | 2.8% | 5.4% | 33.8% | 46.5% | 11.5% |
| 2015 | 43.5 | 52.7% | 47.3% | 74.9% | 11.5% | 5.9% | 7.7% | 2.5% | 4.8% | 32.8% | 47.5% | 12.3% |
SOURCE: IPUMS.
The table contains the basic demographic information. A number of salient features are evident. First, female workers almost doubled their share in the labor force; nowadays, they are close to being half of the working population. Similarly, nonwhites as a whole more than doubled their share, accounting for nearly one in four workers.
An even more dramatic increment is in terms of schooling levels: In 1950, close to 40 percent of workers had only primary schooling (completed or less); today, the U.S. has only a negligible fraction of workers with such little formal education. On the opposite extreme, from having less than 18 percent of workers with at least some college, the U.S. now has about 60 percent of the labor force with either some college education or a completed college education.
A closer inspection of the data reveals that much of the changes took place in the 1970s and 1980s, when the baby boomers entered the labor market. Figure 1 shows the close relationship between the average age of American workers and the fertility rate of previous decades.4
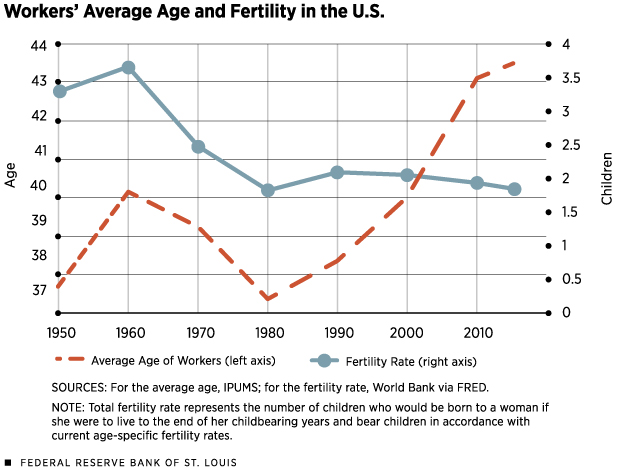
The relatively high fertility rates of the 1950s and 1960s led to an interesting pattern in the age of active workers over the years. First, average ages tended to increase between 1950 and 1960 as young female workers in the 1950s left the labor force to rear children. Later, however, when the baby boomers’ children entered the labor force in the 1960s, the average age started to decline. Yet, with the lower fertility rates observed since the late 1970s and early 1980s, the average American worker started aging, a trend that has remained up until at least 2015, the last year for which we have data.
To be sure, the baby boomers had more formal education than their parents, but the boomers’ education has since been eclipsed by that of their children. It is easy to see why the 1970s and 1980s were years of rapid expansion in the average educational level of American workers. After that, a steady increase in education has been sustained up until 2015, and it is expected to continue.
These changes in the educational level of American workers are significant enough that one would expect to see important changes in the structure of the economy, i.e., in the types of occupations in the economy and the types of workers filling those jobs. The data show this vividly.
Changes in Work and in Who’s Doing What
We now explore the changes in what the American workers do in the marketplace. To this end, we grouped workers into the following nine broad groups,5 ordered by their skill intensity6: professional and technical workers; managers, officials and proprietors; sales workers; clerical and kindred; craftsmen; service workers; operatives (e.g., machine operators); farmers and farm laborers; and laborers.7
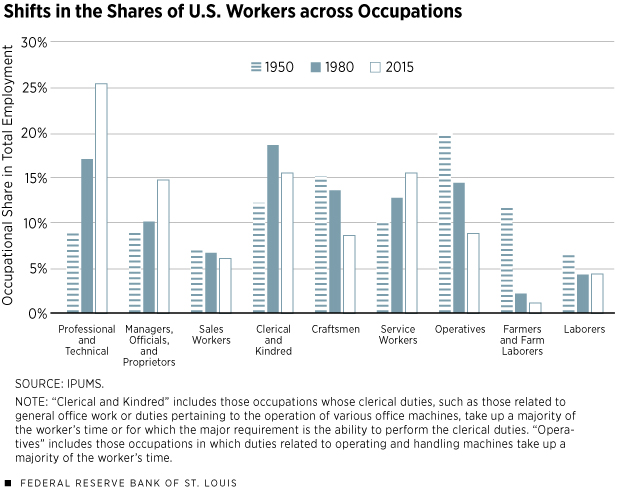
Figure 2 shows the shares of workers across the nine broad occupation categories in the data. For ease of presentation, we reported on the data only for the beginning, the middle and the end of the sample period. For each occupation, the first bar in each case corresponds to American workers in 1950, the middle bar corresponds to workers in 1980 and the last bar corresponds to 2015, the most recent year for the data.
Figure 2 shows important changes in what American workers do. First, there is a big shift toward professional and technical occupations and toward management. The first group almost tripled its share over all workers between 1950 and 2015, from 8.7 percent to 25.4 percent of all workers. The second group, i.e., the management positions, almost doubled its share, from 8.8 percent to 14.7 percent. Another occupation that expanded is service workers, a finding that is not surprising, given the well-known movement of the U.S. economy toward services and away from agriculture and manufacturing. This movement also explains the significant decline in craftsmen, operatives and farm workers.
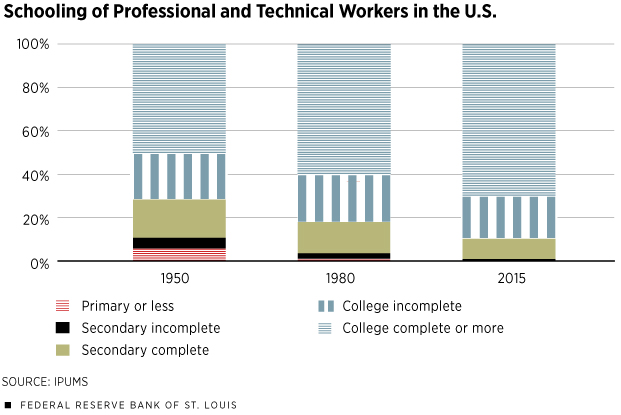
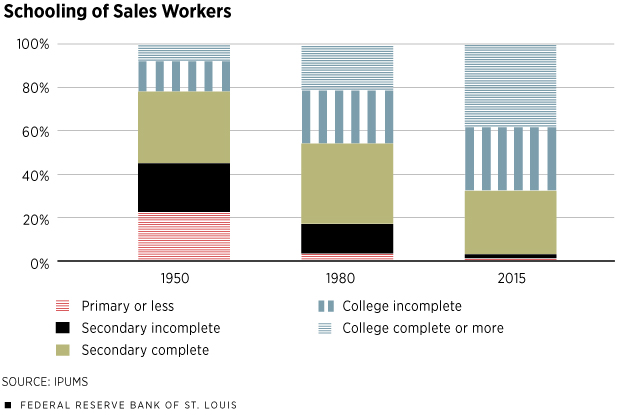
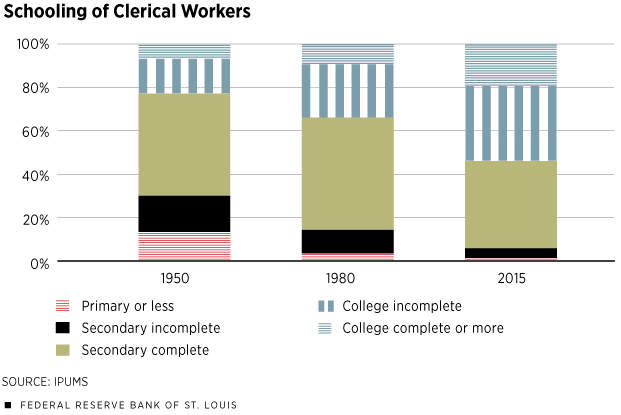
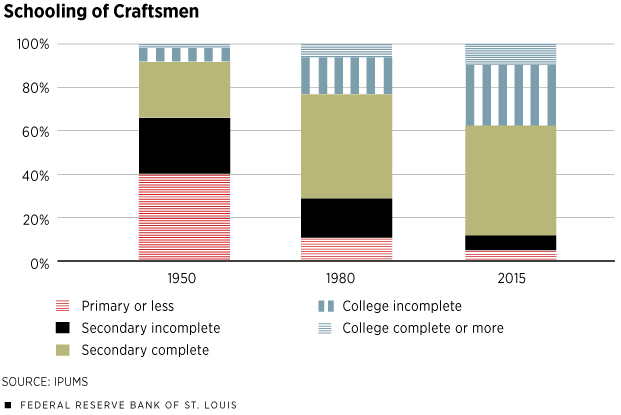
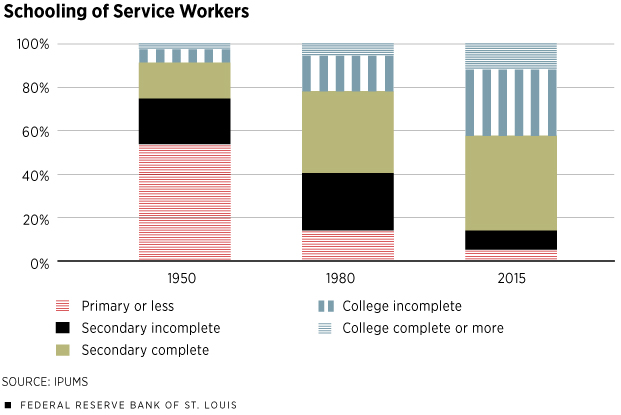
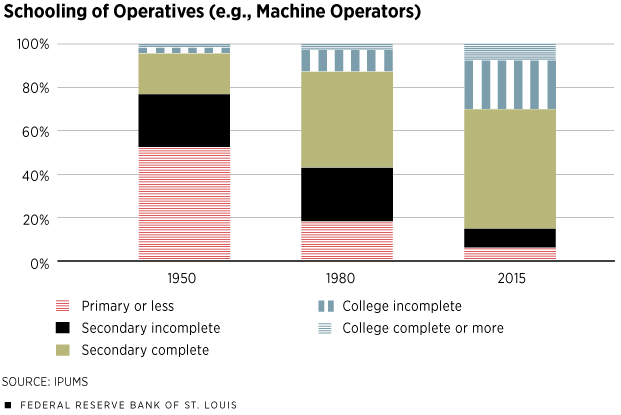
Beyond these profound changes in the occupations or job types, we observed substantial shifts in the types of workers that are allocated across the different types of jobs. Each of the nine panels of Figure 3 shows the share of workers with different schooling levels in each of the nine broad occupation categories. Obviously, the educational level of the workforce was very different in 2015 relative to that of 1950 and even 1980.
Specifically, consider the notable difference in the schooling attainment of workers in professional and technical occupations between 1950 and 2015. In 1950, only half of these workers had completed a college degree. By 1980, those with college degrees already made up 60 percent of these workforces and by 2015 they accounted for 70 percent. In 1950, it was not uncommon to find workers with only a high school diploma in professional positions; in fact, one in 10 of these professional workers had not finished high school, and up to 6 percent of them did not have any secondary education at all. Formally or informally, this subset of professional workers must have accumulated technical knowledge on the job. As Figure 3A shows, this group of empiricist professionals had all but disappeared by 1980 and was completely gone in 2015.
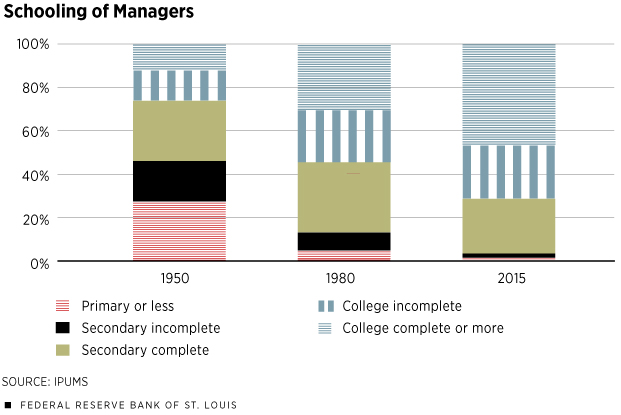
Even more striking changes can be seen in workers occupying managerial jobs. In 1950, managers were predominantly workers with no formal college education: Individuals who had no more than a high school diploma accounted for more than three in four of American managers. (In 1950, 27.4 percent of managers had only primary education and only 11 percent of them had completed college.)
Figure 3B shows the drastic change that has taken place: In 2015, virtually all managers had completed at least secondary education, almost three-fourths of them had some form of college education and 46.4 percent of them had completed at least a college degree.
The movement toward higher levels of education can be seen also in all other occupations, albeit to a different extent. In all of them, there is an increasing share of college-educated workers and a decline in workers with primary education only. The main difference across occupations is in the incidence of secondary education (complete and incomplete) and in workers with some college education. For example, while in 1950 virtually no operative worker had any college education, in 2015 more than 30 percent of these operators had some college.
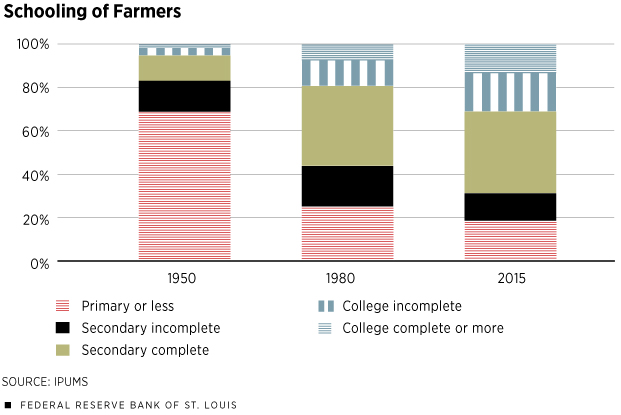
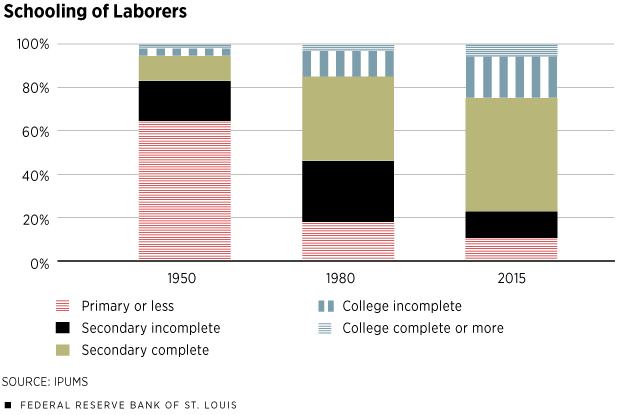
It is noteworthy that the agricultural sectors have attracted—or required—workers with higher levels of education. Nowadays, almost 31 percent of these workers have some college education. Notice that similar numbers apply to the group of laborers.
Despite some ambiguity in the share of workers who have completed secondary school over the years, all occupations in the country have undergone a process of skill upgrade, namely the movement in which the same form of task, job or occupation is now performed by workers with higher skill levels.8 This is most evident when looking at the share of college-educated workers performing more and more of all these broadly defined categories of jobs and also when looking at the sharp decline in the share of workers with only primary school completed. This sharp decline appears even among farmers and laborers, a solid majority of whom have traditionally had only a primary school education.
Top-Earning Occupations
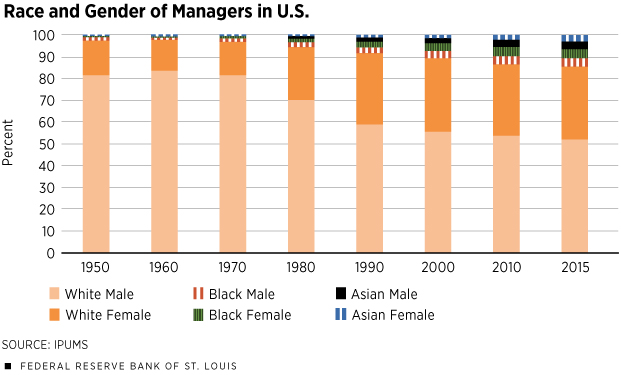
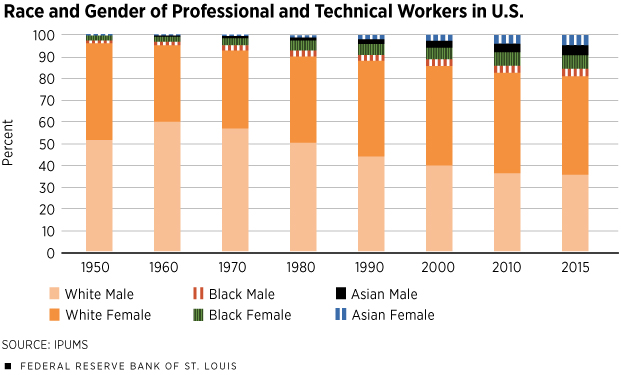
We now look more closely at the managerial and professional occupations, the two occupations that have been expanding at the fastest pace and that are the ones paying the highest salaries. Figure 4 breaks down the composition across gender and race groups for these two broad categories.
As the two panels of Figure 4 clearly show, both occupations have traditionally been performed predominantly by white workers and, up until recently, by predominantly white male workers. But that has changed profoundly. In 1950, white males accounted for more than 81 percent of all managers and for 51 percent of all professional and technical workers. Interestingly, the predominance of white males in both groups was even higher in 1960 and 1970, likely reflecting large numbers of younger, highly educated females leaving the marketplace to raise children. But by 2015, white males accounted for about half of the managers and for about 34 percent of professional workers.
The entry of highly educated white women is one of the main forces behind this change. From essentially being a rarity in the 1950s and 1960s—and even the 1970s—women in management positions accounted in 2015 for one of every three managers in the U.S. White women accounted for even more of the professional occupations, outnumbering white men in 2015.
A second major force of change is the entry of nonwhite workers. Indeed, from virtually being negligible in these two broad groups of higher-paying occupations, nonwhite workers now account for 20 percent of professionals and 15 percent of managers.
The rise of women and nonwhite workers in the marketplace can be tied to higher college enrollment rates over time and to reductions in educational and labor market distortions and barriers. In the case of women, some have argued that technological changes favor female skills and that the combination of women’s higher social skills with increased cognitive skills has also played an important role.9
Conclusions
We explored the substantial shifts in the American labor force and workplace over almost 70 years, showing that the identity, education, race and occupations of the average American worker have all been changing. We documented big changes in the types of jobs being done by American workers and on the assignment of jobs across workers with different educational levels and other characteristics.
The data discussed here provide a number of clear lessons. First, American workers are older, better-schooled and much more diverse in terms of race and gender. Second, employment opportunities have shifted to higher-skilled occupations. Third, there has been a generalized process of skill upgrading, as all occupations are employing workers with more formal education.
Needless to say, these changes have led to additional challenges for some groups of workers: Those with lower levels of education may be unable to find jobs in occupations that their parents held with much less formal schooling. For those with higher levels of education, they now have heightened competition from more individuals with higher education, including groups that were rarely represented in these ranks in the past, e.g., females and nonwhites.
Regardless of how much more challenging labor markets become for everyone, the aggregate productivity is higher when the country takes advantage of the talent of all the demographic groups and not just a subset of them.10
Alexander Monge-Naranjo is an economist at the Federal Reserve Bank of St. Louis. For more on his work, see https://research.stlouisfed.org/econ/monge-naranjo. Juan Ignacio Vizcaino is a technical research associate at the Bank.
Endnotes
- See Monge-Naranjo. [back to text]
- IPUMS-USA, University of Minnesota, www.ipums.org. We discarded individuals whose employment status is unknown or who are unemployed or are not in the labor force, as classified by the variable EMPSTAT codes 0, 2 and 3. Also, see Ruggles et al. [back to text]
- In the database, racial categories consist of national origin groups. Beginning in 2000, the race question changed substantially to allow respondents to report as many races as they felt necessary to describe themselves. In earlier years, only one race response was coded. We grouped nine racial categories reported in IPUMS-USA into four broader groups: white (IPUMS-USA: White), black (IPUMS-USA: Black/African American/Negro), Asian (IPUMS-USA: Chinese, Japanese, Other Asian or Pacific Islander) and other (IPUMS-USA: American Indian or Alaska Native, two major races, three or more major races). IPUMS-USA contains separate information on ethnicity, in particular, whether a worker has Hispanic ethnicity. In a future article, we will focus exclusively on the participation of Hispanic workers in the U.S. labor force and in the different occupations. [back to text]
- Fertility data come from the World Bank and were obtained via FRED at https://fred.stlouisfed.org. [back to text]
- In order for occupations to be comparable across time, we used the 1950 Census Bureau occupational classification. Each of the nine categories groups occupations that are similar in nature according to their three-digit occupational code, the smallest level of desegregation the Census Bureau provides. [back to text]
- The occupations with the highest percentages of workers with the top level of education (college or more) are deemed those that are most skill-intense. The top four occupations were the same in 2015 as in 1950. [back to text]
- Observations of individuals with unclassified, missing or unknown occupations are discarded. [back to text]
- See Costinot and Vogel. [back to text]
- See Rendall, Cortes et al. and Hsieh et al. [back to text]
- This point is forcefully made by Hsieh et al. [back to text]
References
Cortes, Guido M.; Jaimovich, Nir; and Siu, Henry. The End of Men and Rise of Women in the High-Skilled Labor Market. Manuscript, 2016. See http://faculty.arts.ubc.ca/hsiu/work/endofmen_post.pdf.
Costinot, Arnaud; and Vogel, Jonathan. Matching and Inequality in the World Economy. Journal of Political Economy, 2010, Vol. 118, No. 4, pp. 747-86.
Hsieh, Chang-Tai; Hurst, Erik; Jones, Charles I.; and Klenow, Peter J. The Allocation of Talent and U.S. Economic Growth. Manuscript, 2016. See http://klenow.com/HHJK.pdf.
Monge-Naranjo, Alexander. Workers Abroad Are Catching Up to U.S. Skill Levels. Federal Reserve Bank of St. Louis’ The Regional Economist, Third Quarter 2017, Vol. 25, No. 3, pp. 6-7.
Rendall, Michelle. Brain versus Brawn: The Realization of Women’s Comparative Advantage. Manuscript, 2017. See https://sites.google.com/site/mtrendall/research.
Ruggles, Steven; Genadek, Katie; Goeken, Ronald; Grover, Josiah; and Sobek, Matthew. Integrated Public Use Microdata Series: Version 6.0 [dataset]. Minneapolis: University of Minnesota, 2015. See http://doi.org/10.18128/D010.V6.0.

Views expressed in Regional Economist are not necessarily those of the St. Louis Fed or Federal Reserve System.
For the latest insights from our economists and other St. Louis Fed experts, visit On the Economy and subscribe.
Email Us