


Accounting for Age: The Financial Health of Millennials
KEY TAKEAWAYS
- Millennials and Generation X were the youngest working generations in 2016 and 2001, respectively. How do their balance sheets compare?
- Because of fewer assets and more debt, millennial households had an average net worth of about $90,000 in 2016 versus $130,000 for Generation X households in 2001.
- Spending more time in school and delaying marriage and other major life events may explain why millennials have a lower net worth.

There is no shortage of news articles written on the saving and investment behaviors of millennials. What is lacking, however, is a clear picture of what these young people are doing with their money.
The Wall Street Journal has reported concerns about low levels of saving related to mounting student loan and credit card debt. By contrast, the personal finance website NerdWallet pointed out that some millennials are saving considerable amounts for retirement.
There are also conflicting reports on their homebuying behavior. Real estate news website The Real Deal noted that millennials are not buying homes because of high student loan balances, but Business Insider reported that they are waiting longer to purchase their first homes and tend to purchase homes that are more expensive when they do buy.
Given that these articles fail to come to any consensus, we aim to offer a glimpse into the state of millennials’ household finances. To see how millennials fared relative to the previous young generation, Generation X, we compared millennial households’ finances in 2016 to those of Gen X back in 2001.We define millennial households as those whose heads are between ages 20 and 35 as of 2016, and we define Generation X households as those whose heads were in the same age range back in 2001. While there is no clear demarcation of generational boundaries, our definitions roughly match those popularly referenced. We analyzed the average asset and liability positions and their compositions using household-level data from the Survey of Consumer Finances (SCF).The survey provides cross-sectional data on U.S. households’ demographic characteristics, incomes, balance sheets and pensions every three years.
Overall, our analysis indicates that reductions in both financial assets and nonfinancial assets (e.g., a home) contributed to millennials’ having fewer overall assets than Gen Xers had in 2001. In terms of liabilities, the millennials were slightly more indebted on average, as they held a higher amount of student loans that outweighed reductions in mortgage and credit card debt.In addition to average asset and liability positions, we also compared median asset and liability positions across generations. The results are qualitatively similar to the averages. However, the median levels of housing assets, retirement account balances and mortgage debt were zero, making comparisons infeasible. For example, more than half of millennials had no housing assets.
A Lower Net Worth
The average value of total assets was lower among millennials than Gen Xers. As shown in Figure 1, millennials held an average of $162,000 of assets relative to Gen X’s average of $198,000.The dollar numbers reported in the SCF data are inflation-adjusted to 2016 dollars and therefore can be compared directly. In this article, dollar amounts of $20,000 and greater have been rounded to the nearest $1,000; those lower than $20,000 have been rounded to the nearest $100.
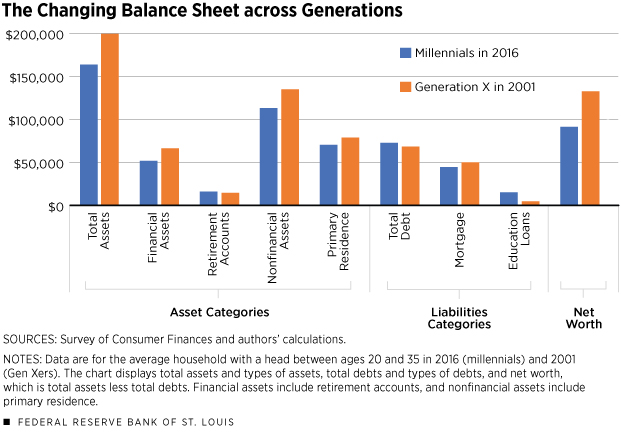
The reduction occurred in both financial and nonfinancial assets. The average financial asset position was around $15,000 lower than in 2001, dropping from $65,000 to $50,000. The reduction of nonfinancial assets was $22,000, dropping from $133,000 to $111,000.
Part of the reduction of the nonfinancial asset position occurred in housing. Millennials held an average of $69,000 in their primary residence, while Gen Xers held an average of $78,000. While millennials held lower levels of assets on average, they had a slight advantage in average retirement account balance, at $15,500 relative to Gen X’s $13,600.
Millennials held a slightly higher level of total debt, at an average of $72,000 compared to Gen X’s average of $67,000. While the average levels of debt were similar across the two generations, the composition was markedly different. Average student loan levels surged from $4,200 for Gen X to $14,700 for millennials. Because of the smaller average value of housing assets for millennials, the level of mortgage debt was also smaller at $43,000 compared to $49,000 for Gen X.
We also observed that the burden of credit card debt among millennials was actually lower than that of the previous generation. The unpaid credit card balance stood at $1,800, which was lower than Gen X’s average $2,700 (not shown in Figure 1).
In short, we see that millennials’ average asset position was lower, while they held slightly more debt, which led to an average net worth of $90,000 for millennials and $130,000 for Gen X.
A Robustness Check
The prices of some asset categories may have changed significantly from 2001 to 2016. While the dollar values in the SCF are inflation-adjusted to 2016 dollars, this does not account for swings in the relative prices between asset categories that could make one category disproportionately more expensive in one year than another.

To alleviate this concern, we performed a simple robustness check. For each asset category, we computed the ratio of the average value for each generation to the average of all households in those respective years. We report the results in Figure 2.
These ratios are best interpreted as a percentage of the average value for all households. For example, a ratio of 0.2 indicates that the generation in question held assets or liabilities equal to 20 percent of the average value across all households in that year.
The orange bar in the total assets category of Figure 2 represents the ratio of the average total assets of Gen X to those of all households in 2001, while the blue bar represents a similar ratio for millennials in 2016.
In this relative measure, the millennials had a significantly smaller asset ratio (21 percent) than Gen Xers (32 percent). The financial assets, nonfinancial assets and housing ratios for millennials each dropped about 10 percentage points, and the retirement account ratio fell by about 5 percentage points.
By contrast, the average debt ratio was lower for millennials. Compared to those of Generation X, the total debt and mortgage ratios were down around 15 and 23 percentage points, respectively. Yet, these lower debt ratios were outweighed by lower asset ratios, thus pushing millennials’ net worth ratio down to 13 percent from 24 percent for Generation X.As always, we cannot rule out that other underlying factors could possibly bias the results shown in both Figures 1 and 2. However, we see similar patterns across both figures, implying a consistent story that millennials hold lower levels of assets and have lower net worth than Generation X on average.
Changing Priorities
The net worth of the youngest working generation fell since 2001, as they held fewer assets and more debt on average.
However, this is not necessarily an indictment of millennials’ spending and saving habits. Society is in a state of transition as the life cycle continues to extend. People have been living longer and retiring later, and with that has come a multitude of other demographic shifts.
Relative to previous generations, more millennials have opted to delay entering the labor market, with many deciding to pursue higher levels of education. The labor force participation rate for 20- to 24-year-olds dropped to 70.5 percent in 2016 from 77.1 percent in 2001. Over the same period, the share of those ages 25 to 29 with four years of college or more increased from 28.4 percent to 36.1 percent. In addition, a higher percentage of young adults are living with their parents, and the median age at first marriage has been increasing for both men and women.The labor force participation rate data are from the Bureau of Labor Statistics, and the demographic data are from the Census Bureau.
We observe that millennials have been going to school longer and delaying major life events. Thus, it makes sense that they hold lower levels of assets. They have had less time in the labor force, and a smaller share of them have moved out on their own, which contributes to the lower levels of residential assets. However, they have shown a higher propensity to save for retirement and to avoid credit card debt.
While millennials hold higher levels of student loans, education is often an investment that improves productivity and future earnings. Given these considerations, the concerns regarding millennials’ spending and saving habits may be at least partially eased, as they will likely have more time in the labor force to accrue assets and pay off their debts.
Endnotes
- We define millennial households as those whose heads are between ages 20 and 35 as of 2016, and we define Generation X households as those whose heads were in the same age range back in 2001. While there is no clear demarcation of generational boundaries, our definitions roughly match those popularly referenced.
- The survey provides cross-sectional data on U.S. households’ demographic characteristics, incomes, balance sheets and pensions every three years.
- In addition to average asset and liability positions, we also compared median asset and liability positions across generations. The results are qualitatively similar to the averages. However, the median levels of housing assets, retirement account balances and mortgage debt were zero, making comparisons infeasible. For example, more than half of millennials had no housing assets.
- The dollar numbers reported in the SCF data are inflation-adjusted to 2016 dollars and therefore can be compared directly. In this article, dollar amounts of $20,000 and greater have been rounded to the nearest $1,000; those lower than $20,000 have been rounded to the nearest $100.
- As always, we cannot rule out that other underlying factors could possibly bias the results shown in both Figures 1 and 2. However, we see similar patterns across both figures, implying a consistent story that millennials hold lower levels of assets and have lower net worth than Generation X on average.
- The labor force participation rate data are from the Bureau of Labor Statistics, and the demographic data are from the Census Bureau.
References
Hudson, E.K. Here’s Why Millennials Aren’t Buying Houses. The Real Deal, Sept. 24, 2017. See https://therealdeal.com/2017/09/24/heres-why-millennials-arent-buying-houses/.
Lebowitz, Shana; and Shontell, Alyson. Millennials Aren’t Buying Starter Homes—They’re Splurging on Million-Dollar Places Instead. Business Insider, Oct. 31, 2017. See www.businessinsider.com/millennials-dont-buy-starter-homes-2017-10.
O’Shea, Arielle. How Millennials Got a 6-Figure Start on Retirement Saving. NerdWallet, Sept. 11, 2017. See www.nerdwallet.com/blog/investing/the-key-to-six-figure-savings/.
Zumbrun, Josh. Younger Generation Faces a Savings Deficit. The Wall Street Journal, Nov. 9, 2014. See www.wsj.com/articles/savings-turn-negative-for-younger-generation-1415572405.


Views expressed in Regional Economist are not necessarily those of the St. Louis Fed or Federal Reserve System.
For the latest insights from our economists and other St. Louis Fed experts, visit On the Economy and subscribe.
Email Us