


Why Was the Decline in U.S. Trade Larger This Time? A Global View
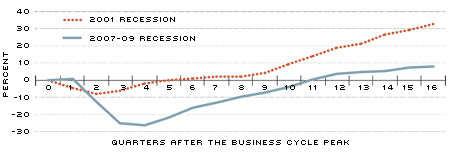
The Great Recession of 2007-09 was characterized in part by a major collapse in international trade. The magnitude of the collapse in U.S. trade was substantially larger than in previous recessions.1 Chart 1 displays the percent change in total U.S. trade (exports + imports) beginning from the peak before each of the two most recent recessions.
The 2001 recession led to an 8 percent drop in U.S. trade two quarters following the previous business cycle peak, and five quarters passed before the volume of trade returned to the prerecession levels. On the other hand, the 2007-09 recession led to a decrease in trade of more than 25 percent four quarters following the previous business cycle peak, and 11 quarters passed before trade returned to its prerecession levels.
As is well-known, overall economic activity slowed down much more in the latest recession than in the 2001 recession; so one might expect a bigger drop in trade in the 2007-09 recession relative to the 2001 recession. However, the decline in U.S. trade relative to U.S. gross domestic product (GDP) was disproportionately larger in the latest recession.
During the 2001 recession, trade relative to GDP bottomed out at about 9 percent below the prerecession level. During the latest recession, the trade-to-GDP ratio bottomed out at about 24 percent below the prerecession level. Thus, even after accounting for the bigger drop in total real GDP in the 2007-09 recession, the decline in trade was almost three times as large as that in the 2001 recession.
To understand the pattern of trade relative to GDP, it would be useful to start with a theory of international trade. Almost two centuries ago, British economist David Ricardo suggested comparative advantage as the basis of international trade.2 He envisioned that countries would specialize in the production of final goods and then engage in trade. That is, one country might produce cloth from start to finish, and another might do the same with wine. Modern trade involves multiple stages of production in which various countries specialize in intermediate inputs at different stages of the production process. For instance, consider the production of an iPhone. A study in 2010 by Yuqing Xing and Neal Detert, researchers at the Asian Development Bank Institute, discusses various components and source countries of those components that go into producing an iPhone.3 While it is well-known that the iPhone is assembled in China, what may be less well-known is that almost all of the intermediate inputs are produced elsewhere. The flash memory and touch screen are produced in Japan, the application processor and RAM memory are produced in Korea, the camera module and baseband are produced in Germany, and so on. China's role in the production of the iPhone is primarily importing and assembling these intermediate inputs into a final product.
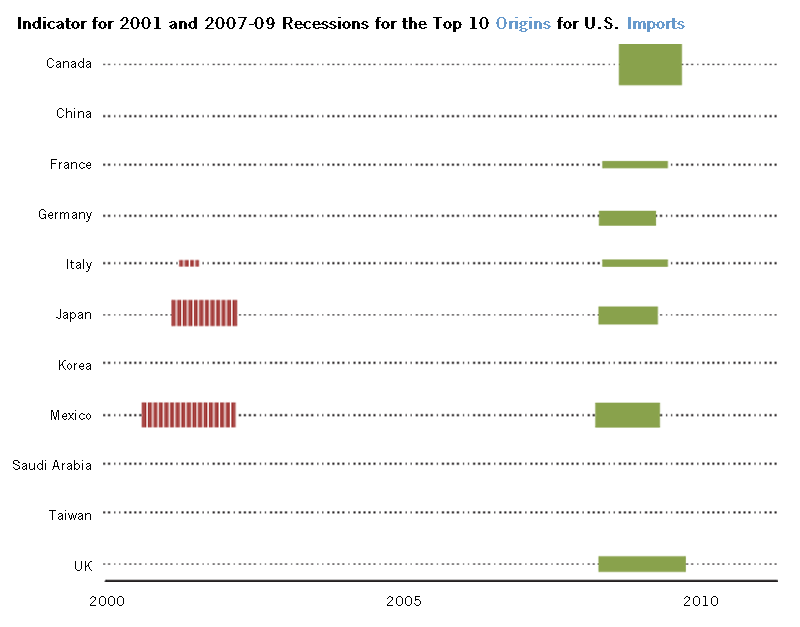
Modern trade resulting from such global supply chains is, thus, determined by economic activity around the world. Put differently, the effect on U.S. trade depends not only on the economic activity in the U.S. but also on the economic activity of its trading partners. The table provides a list of the top 10 U.S. trading partners, both by imports and exports, for the years 2000 and 2008, along with their corresponding shares in U.S. trade.4
The top 10 origins for U.S. imports in 2000 accounted for more than 66 percent of total U.S. imports; the top 10 origins in 2008 accounted for 64 percent. The top 10 destinations for U.S. exports in 2000 accounted for about 66 percent of total U.S. exports; the top 10 destinations in 2008 accounted for almost 60 percent.
Charts 2 and 3 illustrate the economic activity of the top 10 trading partners in
the 2001 and the 2007-09 recessions.5
During the 2001 recession, only four of the top 10 U.S. trading partners were also in recession. The average decline in real GDP for these economies was about 1.5 percent relative to prerecession peaks. In contrast, during the 2007-09 recession, seven of the top 10 origins for U.S. imports were in recession, while eight of the top 10 export destinations were in recession. Real GDP in these countries declined, on average, 7.3 percent relative to prerecession peaks. Thus, the 2007-09 recession occurred "more globally" from the U.S. perspective than did the 2001 recession; the impact was significantly deeper in the trading partners of the U.S. in 2007-09 than in 2001.
Since the major trading partners of the U.S. were in a recession at the same time as the U.S. in 2007-09, foreign demand for U.S.-produced goods declined, which hurt U.S. exports. Similarly, since production fell in the major economies from which the U.S. imports, total U.S. imports declined. In contrast, in the recession of 2001 only a few of the major trading partners were simultaneously in recession, and the magnitude of the recession in those countries was substantially less severe than in 2007-09. Consequently, the effect on U.S. trade was less severe in 2001.
The magnitude of the collapse in U.S. trade in the latest recession was not merely due to the severity of the U.S. recession. Instead, two forces magnified the trade collapse. First, most of the major trading partners of the U.S. were simultaneously in recession, something that didn't occur in previous downturns. Second, countries are more linked via the global supply chain now than they were in previous recessions.
Percent Change in Total U.S. Trade from Business Cycle Peak
SOURCES: OECD Quarterly National Accounts; authors' calculations.
NOTES: Trade is computed as total U.S. imports plus total U.S. exports.
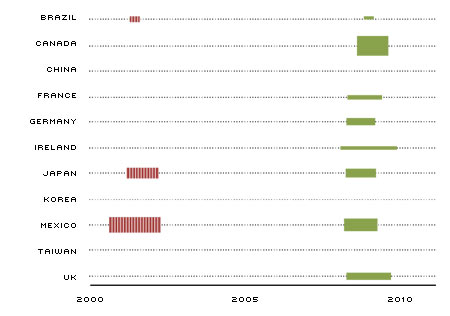
Indicator for 2001 and 2007-09 Recessions for the Top 10 Origins for U.S. Imports
SOURCE: OECD Quarterly National Accounts.
NOTES: A country is identified as in recession if it experiences two consecutive quarters of negative growth in total real GDP. The colored bars represent the recession periods. Red bars (with hashmarks) are approximately within the same period as the U.S. 2001 recession, and similarly the green bars correspond to the U.S. 2007-09 recession. The vertical thickness of each bar corresponds to that country's relative share of U.S. imports, while the horizontal length of the bar corresponds to the duration of that country's recession.
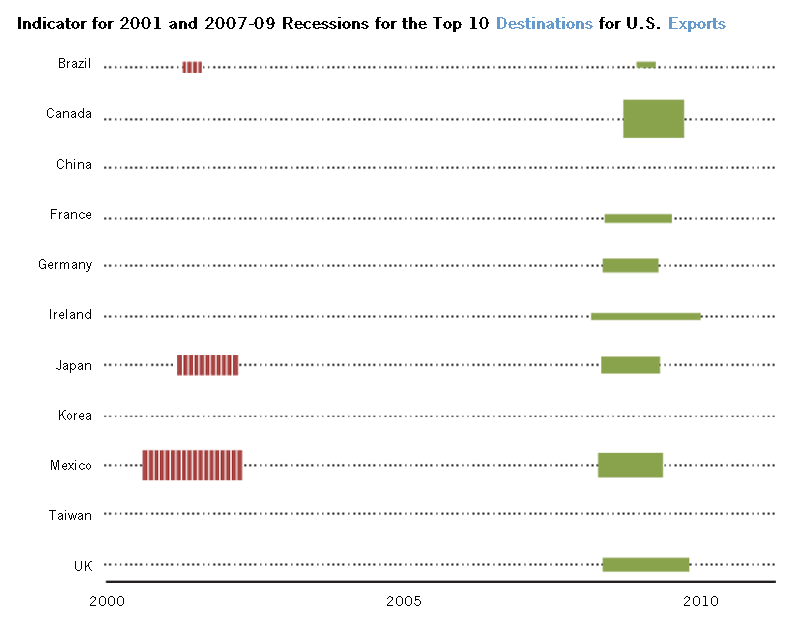
Indicator for 2001 and 2007-09 Recessions for the Top 10 Destinations for U.S. Exports
SOURCE: OECD Quarterly National Accounts.
NOTES: A country is identified as in recession if it experiences two consecutive quarters of negative growth in total real GDP. The colored bars represent the recession periods. Red bars (with hashmarks) are approximately within the same period as the U.S. 2001 recession, and similarly the green bars correspond to the U.S. 2007-09 recession. The vertical thickness of each bar corresponds to that country's relative share of U.S. exports, while the horizontal length of the bar corresponds to the duration of that country's recession.
Endnotes
- See The Economist. [back to text]
- See Ricardo. [back to text]
- See Xing and Detert. [back to text]
- Due to data limitation, we report only the trade shares of the top 10 trade partners of the U.S. for the years 2000 and 2008. Although the overall trade volume varies year by year, the trade shares of the top 10 trade partners are relatively stable over time. Furthermore, the trade shares do not seem to change during the recessions. For example, the trade shares of the top 10 trade partners in 2005 (prerecession) are almost identical to the ones in 2008 (in the middle of the recession). [back to text]
- A country is a top 10 trade partner of the U.S. in a year if it is either among the top 10 origins of U.S. imports or among the top 10 destinations of U.S. exports in that year. [back to text]
References
Ricardo, David. "On the Principles of Political Economy and Taxation." London: John Murray, first edition, 1817.
The Economist. "The Nuts and Bolts Come Apart." March 26, 2009. See www.economist.com/node/13362027.
Xing, Yuqing; and Detert, Neal. "How the iPhone Widens the United States Trade Deficit with the People's Republic of China." Asian Development Bank Institute Working Paper Series, No. 257, December 2010.

Views expressed in Regional Economist are not necessarily those of the St. Louis Fed or Federal Reserve System.
For the latest insights from our economists and other St. Louis Fed experts, visit On the Economy and subscribe.
Email Us