


Output and Unemployment: How Do They Relate Today?
Potential output measures the productive capacity of the economy when unemployment is at its natural rate. Because people move from job to job as a regular event, the natural rate of unemployment is generally believed to be greater than zero: There will almost always be some unemployment in the economy. Thus, potential output is not the maximum an economy could theoretically produce, but a lower, sustainable number.
In most economic models, the level of output that is produced is proportional to the level of the inputs—typically, capital and labor. Thus, one might imagine that increasing unemployment above its natural rate might be associated with output falling below its potential, and vice versa.
This line of thinking led economist Arthur Okun to attempt to uncover a relationship between these two variables: (1) the difference between the actual level of output and its potential and (2) the difference between unemployment and its natural rate. As a byproduct of his study of potential and the natural rate, Okun discovered a strong empirical relationship between output growth and changes in the unemployment rate. In his 1962 paper, Okun used data on the quarter-to-quarter growth rate of the real gross national product (GNP) and the quarter-to-quarter difference in the unemployment rate from 1947 to 1960. He estimated that if real GNP growth were held at zero, the unemployment rate would grow 0.3 percentage points, on average, from one quarter to the next. In addition, for each 1-percentage-point increase in real GNP growth, the unemployment rate would decrease 0.3 percentage points. Economists call this latter number Okun's coefficient. This empirical relationship—dubbed Okun's law—has remained largely intact for 50 years. It is important to note that, although subsequent studies have attempted to develop theories explaining the existence of Okun's law, the original manifestation was a purely statistical relationship. Nonetheless, it has been used in policymaking, in classrooms and in the media. Okun's law is a back-of-the-envelope method of translating changes in production to changes in the unemployment rate.1
Okun's Law over Time
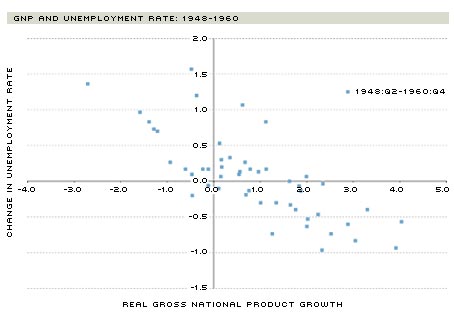
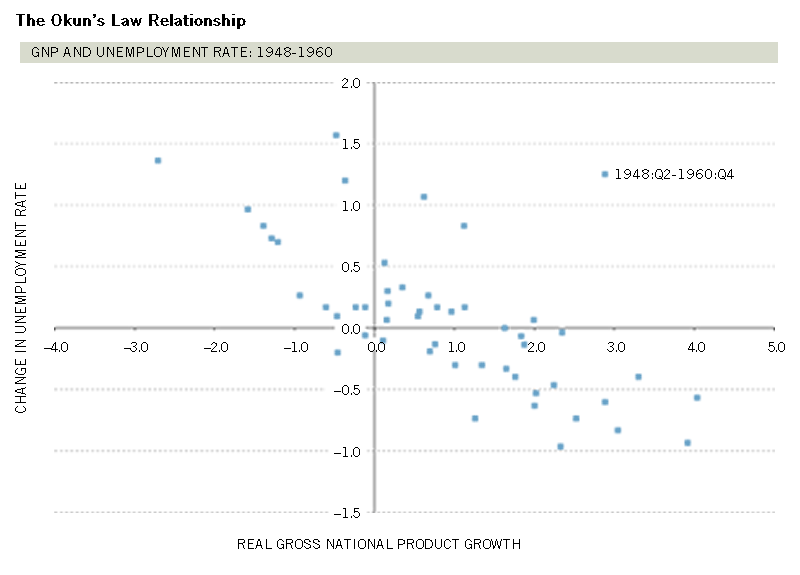
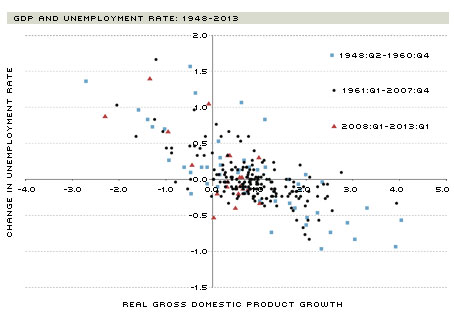
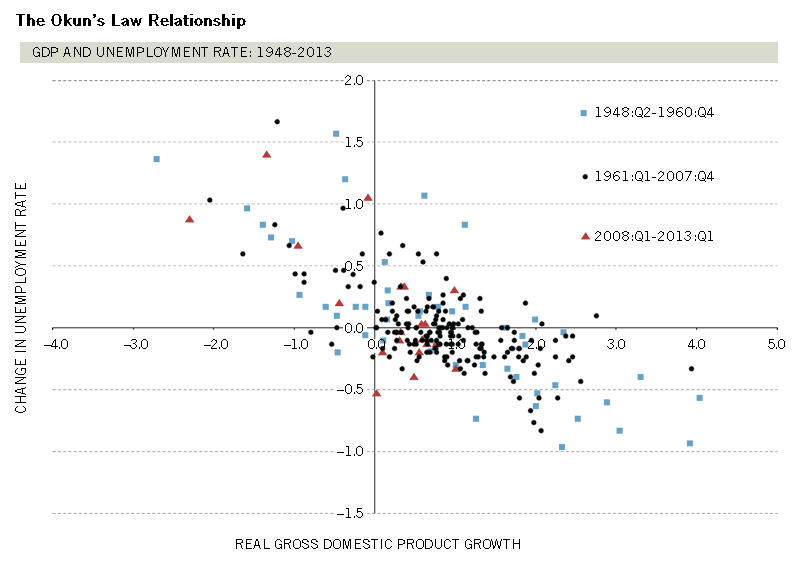
The first panel of Figure 1 shows the data similar to those viewed by Okun in 1962. Because the data have been revised over time, the sample is not identical. Each point represents the quarterly difference in the unemployment rate and the quarterly growth rate in real GNP. Okun essentially drew a line through the cloud of points, measuring the slope and intercept. The absolute value of the slope of this line is Okun's coefficient. The second panel of the figure shows the updated data through 2013:Q1, substituting real gross domestic product (GDP), the current standard measure of output, as the output measure. The red triangles represent the data starting from 2008 through the end of the sample (which spans the Great Recession and the subsequent recovery), and the blue squares represent data from the original Okun sample. Black dots are data from the intervening period. As a basis for comparison, we re-estimated Okun's law for data from 1948 through 2013:Q1. For this sample period, the estimate of Okun's coefficient was 0.28, that is, for each 1-percentage-point increase in the growth rate of real GDP, there was a decrease of 0.28 percentage points in the unemployment rate.
The Okun's Law Relationship
SOURCES: Bureau of Economic Analysis and Bureau of Labor Statistics.
NOTES: The figure shows the relationship between the quarterly difference in the unemployment rate and the quarterly growth rate in output. The left panel shows the relationship from 1948-1960. The right panel shows the relationship from 1948-1960 (blue squares), 1961-2007 (black dots) and 2008-2013 (red triangles).
Over the years, economists have studied Okun's law in various forms using different models, different data and different time samples. One of their motivations has been to determine whether Okun's law has changed over time. In general, the relationship has held up with some variation in the responsiveness of unemployment to the deviation of output from its potential. For example, using the quarterly growth rate of real GDP and changes in the unemployment rate from 1948 to 2007, economist Edward Knotek argued that the magnitude of Okun's coefficient decreased dramatically in the late 1990s and has since remained at a lower level. However, economists Laurence Ball, Daniel Leigh and Prakash Loungani reported in a study earlier this year that these discrepancies largely disappear when using annual data, suggesting that deviations are caused by temporary fluctuations of the unemployment rate or output growth. Overall, the research on Okun's law at the national level shows that the relationship has held in some form for over 50 years.
However, one critique of Okun's law is that it may not hold during and after recessions, as evidenced by the "jobless recoveries" following the past three recessions (1990-91, 2001 and 2007-09). To assess the stability of Okun's law during recessions, Knotek used different time periods from 1948 through 2007 to see how Okun's coefficient changed during time periods with and without recessions. His results suggest that Okun's coefficient is smaller in magnitude during periods of economic expansion than during periods of economic recession. In other words, a 1-percentage-point increase in the output growth rate is associated with a larger decline in the unemployment rate during a recession than during an expansion.
Similarly, economists Michael Owyang and Tatevik Sekhposyan found that the relationship described by Okun's law is less stable during times of high unemployment. Using quarterly GDP and unemployment data, they found that the Great Recession generally increased the size of Okun's coefficient relative to an average historical recession. Further statistical tests, however, indicated that the increases in Okun's coefficient during the three most recent U.S. recessions (1990-91, 2001 and 2007-09) and during the Great Recession alone are not statistically different from Okun's coefficients estimated for historical recessions.
The 2013 study by Ball, Leigh and Loungani also confirms that Okun's coefficient did not change significantly during the Great Recession. This is evident by careful examination of the second panel of Figure 1. The red triangles do not appear to be distributed much differently than the others.
We computed Okun's coefficient using quarterly GDP and the unemployment rate for the recessions defined by the National Bureau of Economic Research's Business Cycle Dating Committee. Okun's coefficients (one for expansion and one for recession) were similar for different business cycle phases even across these periods: The estimated coefficient during expansions was 0.16, while it was 0.17 for periods of recession. These results indicate that there was no clear difference in Okun's coefficient during different stages of the business cycle. Similarly, the estimated Okun's coefficient during the past three recessions was 0.23 and the estimated Okun's coefficient during the Great Recession by itself was 0.22. These estimates are not significantly different from those of all past recessions.
Okun's Law over Space
Most studies of Okun's law use the national level of GDP and the unemployment rate for the entire U.S. International studies of Okun's law have found that Okun's coefficient can vary substantially across countries. This variation could be used to test theories about what determines the magnitude of Okun's coefficient.
We could also examine the variation in Okun's coefficient by state. Indeed, according to economist Donald G. Freeman, "Using regional data to measure Okun's coefficient … has the potential to uncover geographic differences in the responsiveness of labor markets to changes in output."2 These differences could occur for a number of reasons, according to economist Paul Blackley. For example, variation across states can reflect differences in industrial mix (e.g., large fluctuations in unemployment in states with more manufacturing), labor-force characteristics (e.g., states with older labor forces, slower labor-force growth and a higher proportion of male workers have higher unemployment fluctuations) and tax policy (e.g., high income-tax burdens are associated with higher unemployment fluctuations). State-level analysis also has the advantage that national fiscal and monetary policies are essentially the same across states. 3 Controlling for these two factors (national fiscal and monetary policies) allows us to isolate the contribution of intrinsic characteristics, such as industrial mix and the demographics of the labor pool.
Two previous studies of Okun's law using regional data suggest that there may be differences in the regional estimates of the coefficient. One of these studies, by Blackley, estimated Okun's law for 26 states in the U.S. for the 1970-86 period. In this study, he found Okun's coefficients ranged from 0.15 (Louisiana) to 0.47 (Alabama). Blackley then took Okun's coefficients and examined whether there were underlying factors that could explain the differences across states. He found that the differences were related to three factors: the state's industrial mix, labor force and level of personal income tax. Specifically, he found that increases in the share of gross state product (GSP, the state-level equivalent of GDP) attributable to the manufacturing sector and increases in a state's personal tax rate would increase Okun's coefficient. Thus, the unemployment rate is more responsive to changes in output in states that have a higher percentage of income from manufacturing and that have high personal taxes. Blackley also found that states with younger residents and more women in the labor force had lower Okun's coefficients.
A similar study by Freeman in 2000 used annual data for the eight geographic regions defined by the Bureau of Economic Analysis for the 1977-1997 time period. Freeman found that the values of Okun's coefficient ranged from 0.18 to 0.36 for the regions, while the coefficient was approximately 0.19 for the nation. Thus, a 1-percentage-point increase in the growth rate of a region's GSP corresponded to an 0.18- to 0.36-percentage-point reduction in the region's unemployment rate, but a 1-percentage-point increase in the nation's GDP corresponded to only a 0.19 percentage-point reduction in the national unemployment rate. Unlike Blackley's, Freeman's analysis of the factors that could influence the variability in the regional estimates indicated that "there is no obvious pattern to interregional differences in the magnitude of the Okun coefficients."4
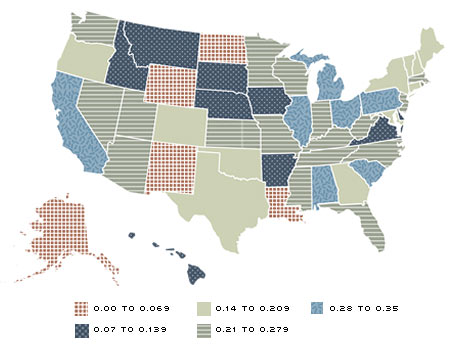
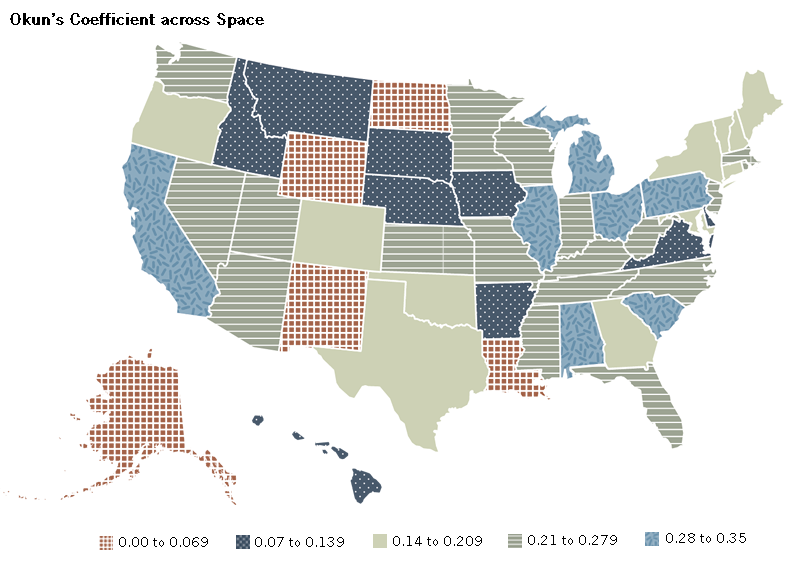
Okun's Coefficient across Space
SOURCES: Bureau of Economic Analysis and Bureau of Labor Statistics.
NOTES: The figure shows the value of Okun's coefficient across states. Our estimated value of the coefficient for the nation was 0.27.
Blackley's study used only 26 of 50 states, and Freeman's study aggregated the states into regions, both of which limit the analyst's ability to determine whether state-level characteristics (demographics, state fiscal policy, etc.) might be correlated with the estimates of each state's Okun's coefficient. We estimated Okun's coefficients for all 50 U.S. states and the District of Columbia using annual data on state unemployment rates and the growth rate of GSP from 1976 to 2012. The accompanying map shows the variation in the estimates of Okun's coefficients for the states. Each colored pattern represents a range of values for Okun's coefficients; these values range from 0.00 (indicating no correlation between state unemployment rates and GSP growth) up to 0.35 (indicating a relatively high correlation). Further, we estimated a national-level Okun's coefficient at 0.27.5 As such, states with light-blue shading (and broken lines) had Okun's coefficients higher than the nation's, states with gray shading (and horizontal bars) had Okun's coefficients similar to the nation's and states with other patterns had Okun's coefficients lower than the nation's.
The largest values of the state-level Okun's coefficients were found for South Carolina and Illinois, at 0.33 and 0.32, respectively. The map indicates that these states, along with Alabama, California, Michigan, Ohio and Pennsylvania, had Okun's coefficients that were larger than that for the U.S. That means that in those states the unemployment rates were more highly correlated with the growth rates of their GSP. Perhaps surprisingly, all other states had unemployment rates less correlated with the growth rates of their GSP. Some states—for example, North Dakota (0.03), Louisiana (0.03) and Alaska (0.02)—appeared to have unemployment rates that were uncorrelated with the growth rate of GSP. These states are shown in a red checkered pattern. In these states, when the growth rate of GSP rose, the unemployment rate was just about as likely to rise as it was to fall.
Some of these states may have had relatively low correlation between output and unemployment because of large transitory fluctuations in either unemployment or output growth. For example, Louisiana may have had less correlation in its unemployment and output relationship because of the high incidences of natural disasters, such as hurricanes. Alaska, Louisiana and Wyoming had the highest percentage of their state income attributable to the energy sector. Large fluctuations in energy prices may have affected their income disproportionately, breaking the correlation between the unemployment rate and GSP.
Are there common factors that determine the magnitude of Okun's coefficients for different states? We did find some regional clustering in the size of the coefficient.
For example, five of the seven states in the Federal Reserve's Eighth District (Arkansas, Illinois, Indiana, Kentucky, Mississippi, Missouri and Tennessee) appeared to have similar correlation between their unemployment rates and the growth rates of their GSP. Only Arkansas and Illinois had very different Okun's coefficients. However, many other states outside of the Eighth District also had similar correlations between their output growth rates and their unemployment rates. Thus, it was unlikely that geography alone was an important factor; it is more likely that it was a proxy for another characteristic, such as those discussed below.
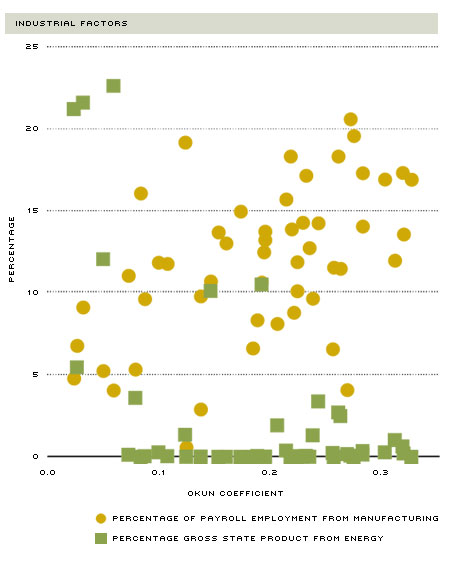
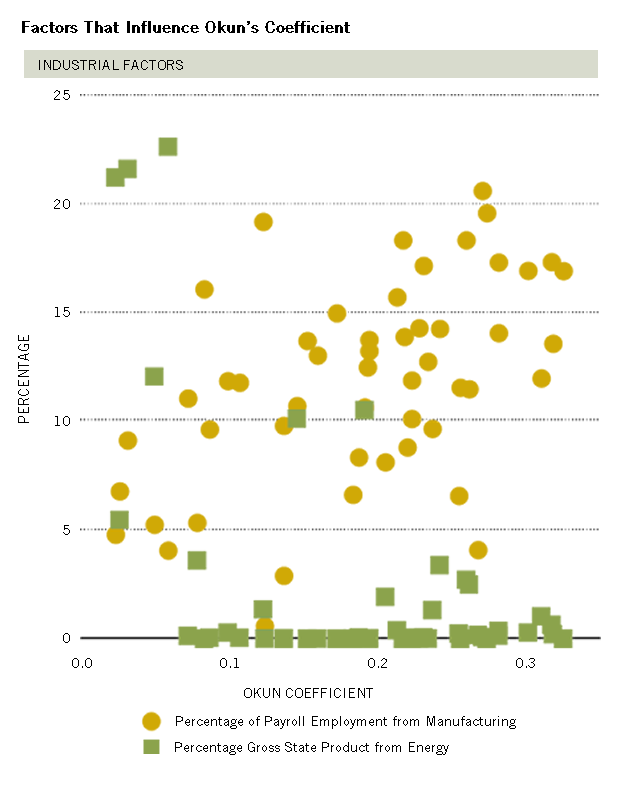
Factors That Influence Okun's Coefficient
SOURCES: Bureau of Economic Analysis and Bureau of Labor Statistics.
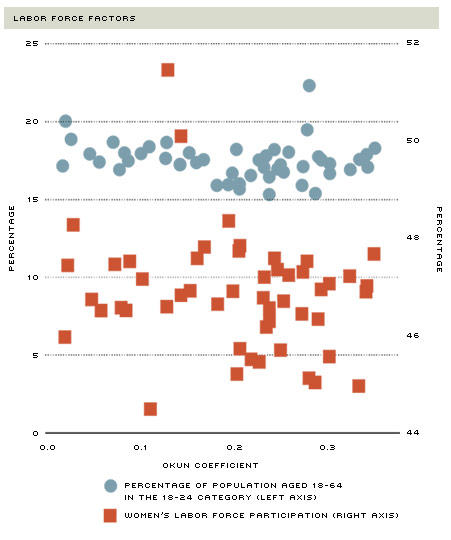
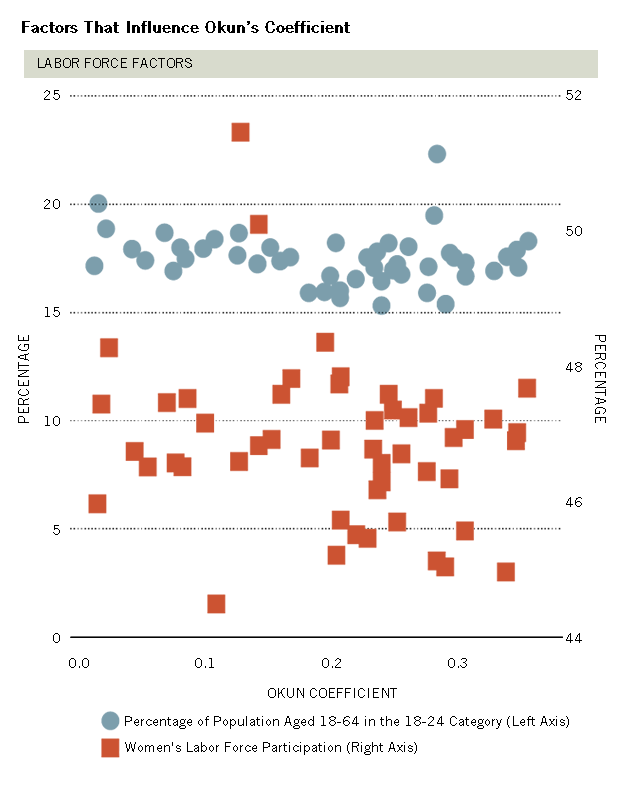
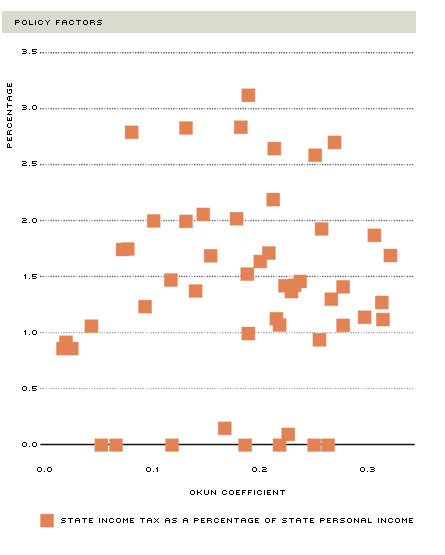
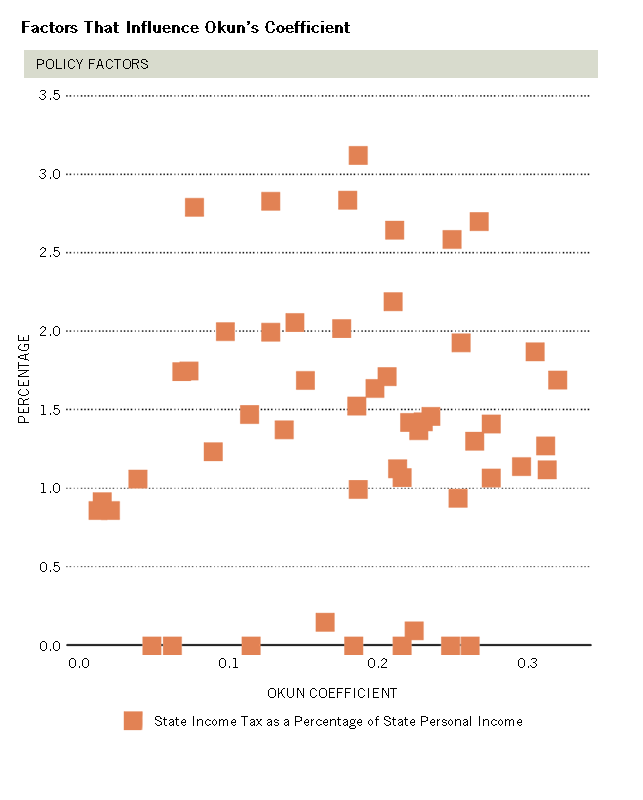
NOTES: The figure shows the relationship between various states' Okun's coefficients and industrial, labor force and policy-level factors. The top panel shows the relationship between Okun's coefficient and the percentage of payroll employment from manufacturing (circles) and the percentage of GSP from energy (squares). The middle panel shows the relationship between Okun's coefficient and the percentage of a state's working-age population under 25 (circles) on the left axis and the female labor force participation rate (squares) on the right axis. The bottom panel shows the relationship between a state's Okun's coefficient and its state income tax as a percentage of state personal income.
We wanted to shed a little light on the factors that might lead to similarity in states' Okun's coefficients. We analyzed whether the size of the coefficient was related to
industrial factors, labor market composition (demographics) and/or state policies. We considered two industrial factors: the percentage of a state's GSP attributable to the energy sector and the percentage of a state's employment attributable to manufacturing.6 The two labor market composition factors were the proportion of the working-age population under age 25 and the female labor force participation rate.7 The state policy variable was the state's personal income tax as a share of state personal income.8
Figure 3 shows the relationship between each state's Okun's coefficient on the x-axis and the industrial-level (top panel), labor market (middle panel) or policy (bottom panel) characteristics on the y-axis. When looking at the percentage of payroll employment from manufacturing (yellow circles), however, there appears to be a slight positive relationship. When looking at the percentage of GSP from energy (green squares), there is no discernible relationship with Okun's coefficient. The points seem randomly scattered. The same can be said for the percentage of the working-age population in the 18-24-year-old category (blue circles), the percentage of women in the labor force (red squares) and the percentage of state personal income from state income taxes (orange squares).
When evaluating the industrial factors both alone and with the other variables, both are statistically important. We found that a 1-percentage-point increase in the percentage of GSP from energy decreases Okun's coefficient by 0.01. This decrease implies that changes in unemployment are less responsive to changes in output in energy-producing states. At the same time, we found that a 1-percentage-point increase in the percentage of payroll employment from manufacturing increases Okun's coefficient by 0.01. This increase implies that changes in unemployment are more responsive to changes in output in areas with more manufacturing workers.
The results of an evaluation of labor force and policy factors imply that the variability in the Okun's coefficients cannot be explained by the factors we chose to examine. The evidence on variation in the industrial composition variables is statistically relevant, but may be economically weak. Taken together, these results support Freeman, who claimed that there was no clear pattern between regions and their Okun's coefficients. We cannot, however, fully conclude that state-level variables do not influence how a state's unemployment rate corresponds to its output growth rate.
Conclusion
It is important, at this point, to highlight a few caveats about Okun's law. First, while Okun's law does fit our intuition about economic relationships (labor markets are weaker when output is low, and vice versa), it should not necessarily be taken to be causal. That is, changes in the production of output appear to be, on average, related to contemporaneous changes in the unemployment rate; these changes in production do not, per se, cause changes in the unemployment rate.
Second, statistical estimates of the relationship involve defining both the natural rate of unemployment and the level of potential output. Because these values are not measured, only estimated, different studies may use alternative measures and find slightly different numerical results.
While Okun's law is often criticized for lacking a theoretical foundation, it does appear to be a robust empirical relationship that has endured over the past 50 years, including during the Great Recession. We found considerable variation in the law across states, suggesting that theories behind the relationship can be tested. A cursory examination of some of the possible causes of this variation showed that employment in manufacturing and output due to energy production are related to Okun's law, implying that Okun's coefficient may vary depending on a region's industrial composition.
Endnotes
- While the relationship can be estimated in reverse to obtain how much output growth might change when observing a given change in the unemployment rate, economists Charles Plosser and G. William Schwert show in their 1979 paper that, for statistical reasons, one cannot simply use the inverse of Okun's coefficient. [back to text]
- See Freeman, p. 558. [back to text]
- Federal government spending and taxes may vary for states with different demographics. In addition, government purchases and federal government employment may vary by state. [back to text]
- See Freeman, p. 567. [back to text]
- This national estimate was based on a regression of differences in the national unemployment rate and the quarterly percent change in gross domestic product, rather than the quarterly percent change in the sum of gross state products. [back to text]
- Manufacturing is the industry thought to drive the business cycle. Thus, higher concentrations of manufacturing might lead to higher Okun coefficients. The energy sector is often counter cyclical (meaning that it sometimes booms when other sectors are contracting). So we might expect smaller coefficients for states with high energy concentration. The state's gross state product attributable to the energy sector is the average of the share of each state's gross state product attributable to oil and gas extraction from 1963 to 1996. The state's percentage of employment attributable to manufacturing is the average of the shares from 1990 to 2012. [back to text]
- The share of the working-age population under 25 is the average of the share of the 18-24 population in the 18-64 population averaged over the 1980-2012 period. The share of women in the labor force is the rate in 1999. [back to text]
- The value represents the average of the rates from 1948-2011. [back to text]
References
Ball, Laurence M.; Leigh, Daniel; and Loungani, Prakash. "Okun's Law: Fit and Fifty?" National Bureau of Economic Research Working Paper No. 18668, 2013.
Blackley, Paul R. "The Measurement and Determination of Okun's Law: Evidence from State Economies." Journal of Macroeconomics, 1991, Vol. 13, No. 4, pp. 641-56.
Freeman, Donald G. "Regional Tests of Okun's Law." International Advances in Economic Research, 2000, Vol. 6, No. 3, pp. 557-82.
Knotek II, Edward S. "How Useful Is Okun's Law?" Federal Reserve Bank of Kansas City Economic Review, 2008, Fourth Quarter, pp. 73-103.
Okun, Arthur M. "Potential GNP: Its Measurement and Significance." In Proceedings of the Business and Economics Statistics Section. Alexandria, Va.: American Statistical Association, 1962, pp. 98-103.
Owyang, Michael T.; and Sekhposyan, Tatevik. "Okun's Law over the Business Cycle: Was the Great Recession All That Different?" Federal Reserve Bank of St. Louis Review, September/October 2012, Vol. 94, No. 5, pp. 399-418.
Plosser, Charles I.; and Schwert, G. William. "Potential GNP: Its Measurement and Significance: A Dissenting Opinion." Carnegie-Rochester Conference Series on Public Policy, 1979, Vol. 10, No. 1, pp. 179-86.

Views expressed in Regional Economist are not necessarily those of the St. Louis Fed or Federal Reserve System.
For the latest insights from our economists and other St. Louis Fed experts, visit On the Economy and subscribe.
Email Us