District Overview: Tax Revenue Collections Slow Down Even More in the Eighth District States
State tax revenue continued to decline in fiscal year (FY) 2010 for the Eighth District states as well as for the combined 50 states.1 At the same time, unemployment rates have been only gradually dropping, while assistance programs, such as unemployment insurance and Medicaid, continue to remain in high demand. As a result, states are facing large budget shortfalls that are becoming increasingly difficult to fill.
The 50 states will face a combined budget shortfall of $260 billion over the two-year period of 2011 and 2012, according to estimates from the Center on Budget and Policy Priorities.2 To make matters worse, federal stimulus funding is running out, and concerns about the expanding federal debt may preclude states from receiving further assistance. Consequently, states face difficult decisions, including higher taxes and/or further cuts to public programs.
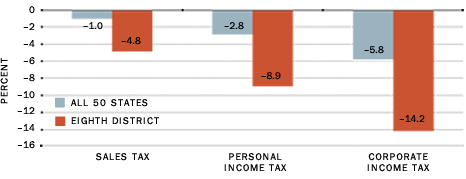
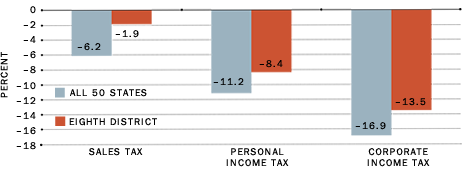
Although still on the decline, the decreases in the combined 50 states' tax revenue have leveled off in FY 2010 compared with FY 2009.3 In FY 2010, sales tax, personal income tax and corporate income tax revenue were down 1 percent, 2.8 percent and 5.8 percent respectively. In contrast, FY 2009 tax revenue dropped 6.2 percent, 11.2 percent and 16.9 percent respectively. These three sources make up roughly 80 percent of states' general fund revenue.4
Figure 1 shows that the change in tax revenues averaged over the Eighth District states was much worse than the national average in FY 2010.5 Sales tax, personal income tax and corporate income tax revenue fell 4.8 percent (1 percent for the nation), 8.9 percent (2.8 percent) and 14.2 percent (5.8 percent), respectively. These numbers contrast sharply with the preceding fiscal year (FY 2009, Figure 2), when Eighth District tax revenue fell 1.9 percent (6.2 percent for the nation), 8.4 percent (11.2 percent) and 13.5 percent (16.9 percent).
All seven of the District states experienced a decline in sales tax revenue in FY 2010. Sales tax revenue often falls when economic uncertainty discourages consumers from spending their disposable income. The states that experienced the largest declines were Illinois (–8.5 percent), Mississippi (–8.1 percent) and Arkansas (–6.1 percent). Interestingly, Indiana shifted from an 8.2 percent gain in sales tax revenue between FY 2008 and FY 2009 to a 3.6 percent decline between FY 2009 and FY 2010. Mississippi's revenue also significantly decreased between the same two periods with a shift from a –1.3 percent change to a –8.1 percent change.
Personal income tax revenue continued to decline across all seven District states in FY 2010. Personal income tax revenue falls when the unemployment rate is high because unemployed workers have significantly lower income subject to taxes. The largest declines were seen in Tennessee (–13.8 percent), Indiana (–12.5 percent) and Missouri (–10.6 percent). Between FY 2009 and FY 2010, Missouri and Mississippi experienced a greater decline (–10.6 percent and –8.3 percent respectively) in personal income tax revenue compared with the decreases between FY 2008 and FY 2009 (–6.4 percent and –4.4 percent, respectively.)
Five of the seven District states experienced a decline in corporate income tax revenue in FY 2010. Corporate income tax revenue declines as business revenues decrease due to a recessionary economic climate, which is characterized by lower demand and tighter credit conditions. Of the District states, Indiana (–34.8 percent), Illinois (–23.4 percent) and Missouri (–19.5 percent) experienced massive declines in corporate income tax revenue. The percentage declines between FY 2009 and FY 2010 for Indiana and Illinois were much more severe than the respective 7.8 percent and 8.1 percent declines experienced between FY 2008 and FY 2009. In contrast, Arkansas has been a bright spot for the District due to increases in corporate income tax revenue both between FY 2009 and FY 2010 (7.4 percent) and between FY 2008 and FY 2009 (1.6 percent).
Stimulus funds have helped to alleviate some of the growing financial pressures on state budgets experienced during and after the recession. The American Recovery and Reinvestment Act set aside about $135-$140 billion over 2 1/2 years to help states maintain their current budgets. The Center on Budget and Policy Priorities estimates that $102 billion of the stimulus funds has already been disbursed to states over FY 2009 and FY 2010. That leaves about $36 billion or 26 percent of the total amount for FY 2011 and beyond.
With the stimulus funds almost depleted, states will have a more difficult time dealing with budget deficits than in the past two years, especially with the continued decline in tax revenue. To rectify this, further stimulus funding could be appropriated toward alleviating the financial burden on state budgets.6 However, concerns about continued deficit spending and about the growing federal debt have made federal lawmakers apprehensive about providing further financial assistance.
If the economic recovery continues to progress, states will see improvements in the three major tax revenue sources. Indeed, for the combined 50 states, the declines in FY 2010 were much lower across all three major tax categories than in FY 2009. By comparison, the combined District states suffered larger declines in FY 2010 than in FY 2009. The cause of this reversal is not quite clear, nor is it certain that it will be sustained. Regardless, Eighth District states face a troublesome task of reconciling falling tax revenue, assistance programs that are in high demand and an economic recovery that has been slower than desired.
Fiscal Year 2010 Change in Tax Revenue Collections

SOURCE: National Governors Association and the National Association of State Budget Officers (2010)
Fiscal Year 2009 Change in Tax Revenue Collections

SOURCE: National Governors Association and the National Association of State Budget Officers (2010)
Endnotes
- The fiscal year for most states, including all of those in the Eighth District, ends June 30. The exceptions are: Alabama and Michigan, Sept. 30; Nebraska and Texas, Aug. 31; and New York, March 31. [back to text]
- See McNichol et al. [back to text]
- All tax revenue data are from the National Governors Association and the National
Association of State Budget Officers. Data for FY 2009 represent actual revenue, while FY 2010 data are estimates of tax revenue as of June 2010. [back to text] - See National Governors Association and the National Association of State Budget Officers. [back to text]
- Data for the Eighth District states pertain to the entire respective states even though only parts of six of these states are in the District. [back to text]
- See McNichol et al. [back to text]
References
McNichol, Elizabeth; Johnson, Nicholas; and Oliff, Phil. "Recession Continues to Batter State Budgets; State Responses Could Slow Recovery." Center on Budget and Policy Priorities, July 2010. See www.cbpp.org/cms/index.cfm?fa=view&id=711
National Governors Association and the National Association of State Budget Officers. The Fiscal Survey of the States, June 2010. See www.nasbo.org/LinkClick.aspx?fileticket=gxz234BlUbo%3d&tabid=38
Views expressed in Regional Economist are not necessarily those of the St. Louis Fed or Federal Reserve System.
For the latest insights from our economists and other St. Louis Fed experts, visit On the Economy and subscribe.
Email Us


