


The Foreclosure Crisis in 2008: Predatory Lending or Household Overreaching?
Watching southern Florida home prices spiral out of reach, Mr. Briar decided to take the plunge in 2004 and buy his first home. The mortgage broker he worked with encouraged him to enter into a 2/28 contract, in which the interest rate is fixed for the first two years and then resets to a higher floating rate. Mr. Briar bought the home, and the mortgage broker transferred the loan to Wall Street, where it was packaged and securitized into a collateralized debt obligation (CDO). Mr. Briar struggled to pay his mortgage even during the first two years. Meanwhile, Florida home prices plunged, and, eventually, Mr. Briar permanently defaulted on his loan. The servicing bank foreclosed nine months later.
Although Mr. Briar is a fictitious person, this story has played out for millions of households over the past few years. Did Mr. Briar overreach by taking on too much housing debt, or was he duped by Wall Street? The answer is difficult to ascertain because it ultimately depends on the intentions of the borrower and the lender. After the fact, a lender would hardly admit to deceiving a borrower, and the borrower would be more than willing to place at least some of the blame for the foreclosure on the lender.
Certainly, both predatory lending and household overreaching occurred during the subprime housing bubble. But it is important to identify the primary reason for the foreclosure crisis because the policy implications are vastly different. If predatory lending was the primary culprit, strong consumer protection laws like those in the Dodd-Frank law might be sufficient to avoid a future foreclosure crisis; that's because such laws would prevent Wall Street banks from making high-risk loans that borrowers could not possibly afford. If household overreaching was the primary culprit, preventing another foreclosure crisis is a much more complex policy challenge. A return to high appreciation in home prices could again set off dynamics in which even borrowers with decent credit would overreach and end up in homes they ultimately couldn't afford. The only comprehensive solution might be to prevent the formation of asset price bubbles, a solution that would require policymakers, such as the central bank, to recognize and deflate such bubbles when they occur.
To distinguish between the predatory lending and overreaching hypotheses, we tapped two nationwide data sources to analyze the characteristics of households in foreclosure. Because private motivations were unobservable, we argue that households with low income and education levels should be the most vulnerable to predatory lending practices because such borrowers, all else equal, are more likely to have a poorer understanding of the contract terms at the time of origination. In contrast, households most susceptible to overreaching are those that have high economic aspirations relative to their current income and net worth; these households could already have relatively high incomes and be well-educated.
Profiles of Foreclosed Households
The data used in our analysis of foreclosed households came from two sources. RealtyTrac compiles nationwide data on homes in foreclosure. Acxiom compiles data on millions of U.S. households each quarter and segments households based on economic, demographic and consumption patterns. To obtain a profile of foreclosed households, we combined these two large datasets by household for the third quarter of 2008. The dataset contains more than 40 million records and more than 200,000 foreclosures.
Figure 1 presents key statistics from our dataset on households in foreclosure alongside households not in foreclosure. Defaulted homes were more expensive, on average. The median market value of homes in foreclosure was $242,400 versus $199,129 for homes not in foreclosure. As expected, the median loan-to-value ratio was much higher on defaulted properties, at 96 percent, which was more than 30 percentage points higher than on nondefaulted properties. Homes in foreclosure also were slightly newer and smaller in terms of square footage.
Household characteristics, shown in the bottom panel, reveal that households in foreclosure had slightly fewer members and were significantly younger. The median head-of-household age for a foreclosed household was 44, eight years younger than the median for households not in foreclosure. Heads of households in foreclosed properties were less likely to be married and more likely to be single. They had lower incomes and much shorter length of residence. Although mean years of education were similar at just over 14, households in foreclosure had a median 12 years of education compared with a median of 16 years for households not in foreclosure.
Because we were interested in identifying the characteristics of households that were responsible for a disproportionate number of foreclosures, we looked beyond the simple averages described above. PersonicX Life Stage Segmentation is an Acxiom classification scheme that divides households into 21 life stages based on marital status, number of children in the household, employment status and other socio-economic characteristics.1 A number and letter correspond to the name of each group listed in Figure 2. The number corresponds to the age of the group, with lower numbers representing younger demographics; the letter approximates the group's cultural generation. Groups ending in B represent the Baby Boomers, while X and Y represent Generation X and Generation Y. M represents the Mature generation, mostly those in their 50s and 60s, and S represents Seniors, most of whom are retired.
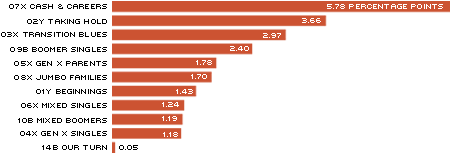
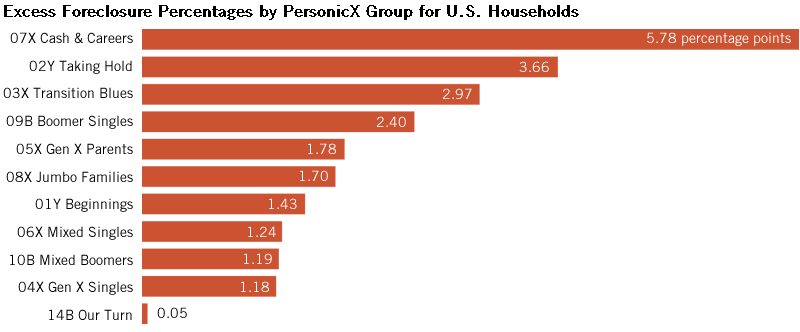
Excess Foreclosure Percentages by PersonicX Group for U.S. Households
SOURCES: Acxiom, RealtyTrac and authors' own calculations.
The figure shows the groups of people with the highest excess foreclosure rates. The classifications come from Acxiom's PersonicX Life Stage Segmentation. In the names of the groups, the lower numbers represent younger people. The letters after the numbers stand for: B=Baby Boomers, X=Generation X and Y=Generation Y. For example, 07X Cash & Careers accounted for 5.52 percent of all households but 11.3 percent of all foreclosures, meaning its excess share of foreclosures was 5.78 percentage points.
To see which of the 21 PersonicX groups contributed the most disproportionately to the foreclosure crisis, we calculated the share of total foreclosures represented by each group and the share of all households represented by each group. We subtracted the household share from the foreclosure share to derive the "excess foreclosure shares" of each group. Group 07X, for example, accounted for 5.52 percent of all households but 11.3 percent of all foreclosures. The excess share of foreclosures is the difference of these two ratios, or 5.78 percentage points. Figure 2 plots the 11 PersonicX Groups with the highest excess foreclosure shares.
Figure 2 shows that excess foreclosures came primarily from younger, relatively affluent households, a finding more consistent with the overreaching hypothesis. In particular, the group with the largest number of excess foreclosures was 07X, Cash & Careers. This Generation X group was the most prosperous of the generation of adults born in the mid-1960s and early 1970s. Out of the first 10 PersonicX groups with excess foreclosures, Cash & Careers members ranked first in average household income ($59,500), net worth and years of education (14.8). The second most-overrepresented group in terms of excess foreclosures was 02Y, Taking Hold. These were Generation Y households with an average age of 27.8 years, second-highest average income ($55,500), third-highest net worth and fifth-highest education level (14.1 years). These two groups' characteristics were consistent with our expectations of households that are most likely to overreach.
The two groups in Figure 2 that were most likely to be victims of predatory lending were Group 01Y, Beginnings and Group 06X, Mixed Singles because these groups ranked ninth or 10th in income, net worth and education. Yet these groups ranked seventh and eighth, respectively, in share of excess foreclosures, and jointly, they accounted for just 2.67 percentage points of excess foreclosures relative to 9.44 percentage points for groups 07X and 02Y.
Rather than rely solely on Acxiom's groupings, we also separated all the households into quadrants based on income and education to identify the most leveraged households in each quadrant based on their loan-to-income ratio. We conjectured that the most over-leveraged households in the low-income, low-education (bottom) quadrant were more likely to be victims of predatory lending, while the most overleveraged households in the high-income, high-education (top) quadrant were more likely to have overreached. Our tests showed that the most-leveraged households in the top quadrant were statistically more likely to enter foreclosure than the other households in the same quadrant. This pattern was not true, however, for households in the bottom quadrant. Once again, overreaching appeared to be the more important explanation of mortgage foreclosure.
Geographic Patterns of Foreclosures
In addition to household profiles, our hypotheses also have differing implications for the geographic distribution of foreclosures. The predatory lending hypothesis predicts that the geographic distribution of foreclosures will reflect the spatial distribution of low-income and low-educated households because bankers (or their brokers) will seek out households most easily deceived, regardless of the household's location. In contrast, the overreaching hypothesis predicts that bubble dynamics will be the important factor explaining the foreclosures. This hypothesis implies that foreclosure rates will spike in specific "hot spots" where households and speculators bid up prices in an effort to buy more-expensive homes before these homes become unaffordable.
We identified real estate hot spots using data from the Federal Housing Finance Agency House Price Index between 2000 and 2007. The areas with the most significant home appreciation are Florida and the states in the Southwest and in the Northeast.
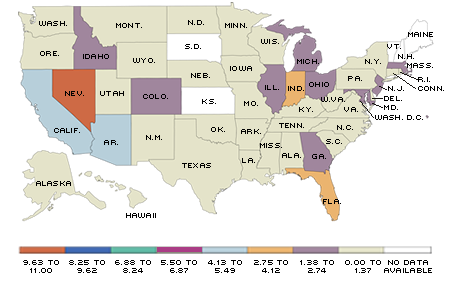
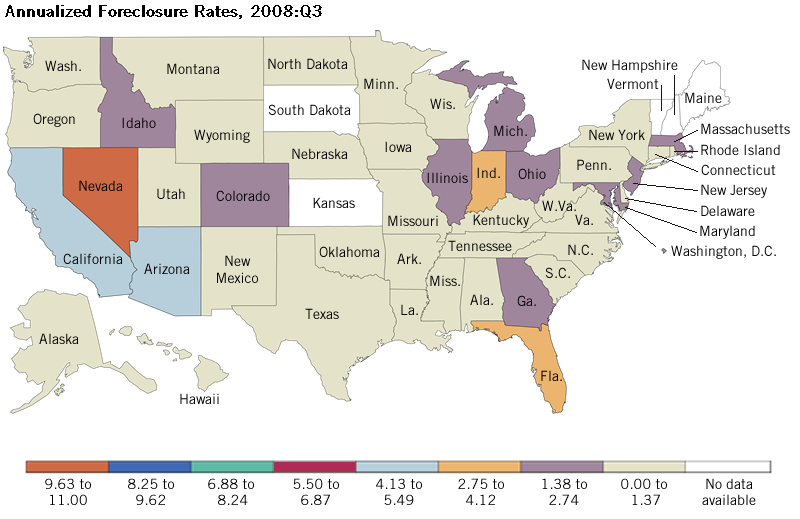
Figure 3 is a map of foreclosure rates by state for the third quarter of 2008. The overreaching hypothesis suggests that there should be a strong correlation between the states with the greatest price increases and the states with the highest foreclosure rates. Indeed, the concentration of foreclosures in the Southwest and in Florida is consistent with overreaching as a more important explanation than predatory lending for the foreclosure crisis. The main outliers in Figure 3 are the Great Lakes states, such as Michigan, Illinois, Indiana and Ohio, all of which experienced moderate home-price appreciation but relatively high foreclosure rates. Foreclosures in these states are more likely driven by a weak economy rather than by housing price bubbles.
Annualized Foreclosure Rates, 2008:Q3
Click to enlarge [back to text]
SOURCE: RealtyTrac
The foreclosure percentages for each state were calculated by taking the annualized number of households that were in foreclosure during the third quarter of 2008 and dividing them by the total number of households in that state.
To more firmly support this visual evidence, we ranked all of the 50 states by home price appreciation (between 2000 and 2007) and foreclosure rates (in 2008) to evaluate their statistical correlation. The overreaching hypothesis suggests that these two characteristics should be positively correlated. Indeed, for all the states, the correlation is 0.23—positive as the overreaching hypothesis suggests, though not statistically different from zero. When we exclude the Great Lakes states, however, the rank correlation rises to 0.43 and is statistically significant. Again, the evidence is more consistent with the overreaching hypothesis than with the predatory lending hypothesis.
Policy Response to Asset Bubbles
By combining household foreclosure data from RealtyTrac with household data from Acxiom, we were able to create a profile of households in foreclosure during the early stages of the financial crisis. We found that many foreclosed households were young with relatively high income and education levels. Moreover, geographic foreclosure patterns were consistent with bubble dynamics as illustrated by the positive correlation between home-price appreciation and subsequent foreclosure rates. The weight of the evidence supports the overreaching hypothesis. Consequently, strong predatory lending restrictions, while desirable, would likely be insufficient to avoid a future foreclosure crisis should another housing bubble emerge.
In our view, the ultimate underlying cause of the foreclosure crisis was the emergence of a significant housing price bubble and its subsequent collapse. Unfortunately, preventing asset price bubbles is a much more complex policy problem to address than protecting consumers from predatory lending.
The late economist Hyman Minsky argued that capitalist economies go through leverage cycles, in which credit access becomes progressively easier as an economy grows strongly. The success of lenders and firms in the good years, combined with appreciating capital assets, reduces the perception of risk and encourages increasingly riskier financing. Financial innovation exacerbates the leverage cycle as financial firms devise new ways to extend credit. Eventually, asset prices peak and then begin to decline, financial instability emerges and latent systemic risk is unleashed in a financial crisis.
This leverage cycle, which Minsky called the financial instability hypothesis, may be inherent to the capitalist system. Minsky's thesis might portray the subprime financial crisis quite well, but it also would suggest that future crises can result from asset bubbles in other sectors of the economy, not just housing.
If capitalist economies are subject to periodic asset price bubbles, Minsky suggested that policymakers take steps to eliminate bubbles that threaten to become systemically important. This, of course, requires the ability to 1) recognize an asset bubble, 2) classify the bubble as a systemic risk to the economy and 3) curb the formation of the bubble either through monetary policy actions or through more-targeted interventions, such as higher bank capital requirements or more stringent mortgage underwriting criteria.
Endnotes
- A list of the 21 PersonicX life stages and their descriptions is available from the Acxiom web site at acxiom.com/personicx/ [back to text]
References
Minsky, Hyman P. Stabilizing An Unstable Economy. New York: McGraw Hill, 2008. Originally published by Yale University Press, New Haven, Conn., 1986.

Views expressed in Regional Economist are not necessarily those of the St. Louis Fed or Federal Reserve System.
For the latest insights from our economists and other St. Louis Fed experts, visit On the Economy and subscribe.
Email Us