


Eighth District Banks' Recipe for Profits
Commercial banks in the Eighth Federal Reserve District had a blue-ribbon year in 1992. With interest rates declining steadily throughout the year, one might have expected banks to have made a decent showing. But with improvements in asset quality added to the mix, District banks boosted their earnings during the year to $1.66 billion, a jump of almost 30 percent from 1991. Measures of profitability were up substantially, particularly return on average assets (ROA), the industry's major indicator. Moreover, average ROA at District banks in each size category exceeded the industry benchmark of 1 percent.
What ingredients made 1992 such a good year for banks? Were low interest rates the main story? The table, which breaks down District banks' income statement into its major components, helps answer these questions.
The Main Ingredients: Interest Income and Expense
The bulk of a bank's revenue and profits is generated in its loan portfolio, the "bread and butter" business of banks. Primarily because of interest rate declines, all three groups of District banks experienced declines in their ratios of loan earnings to average assets in 1992. The loan interest income ratio was highest for mid-sized banks and lowest for large banks. One explanation for the big differences in such ratios at large vs. small or mid-sized District banks is that large banks tend to operate in metropolitan areas, where numerous institutions compete on price for consumer and commercial customers.
Interest income from investment securities holdings—U.S. Treasury bills, bonds and notes, government agency securities, taxable and tax-exempt municipal securities and corporate and other debt securities—was the second-largest source of revenue. District banks have increased their securities holdings since 1989 because of weak loan demand. Securities provide a surer source of income than loans (because they are largely free of credit risk—the risk of non-repayment), but tend to yield less than loans and can subject a bank to interest rate risk. Still, securities holdings provide interest income, and most are sufficiently marketable that they can be sold quickly to meet liquidity needs.
Other interest income comes from leases, assets held in trading accounts, fed funds sold (overnight loans to other financial institutions), repurchase agreements and other balances due from depository institutions. Like loan and securities interest income, this category of income declined because of the general decline in interest rates. Altogether, declines in yields on banks' earning assets led to declines in the interest income ratios of the three sets of banks ranging from 97 to 128 basis points.
Declines in interest expense, however, more than compensated for the declines in interest income. Banks of all sizes were able to reduce the cost of their liabilities by sharply curtailing the rates they paid on deposits; because loan demand was weak, banks were also able to reduce their expenditures on purchased liabilities such as fed funds, whose rates also declined. The end result: sharp increases in net interest margins at all groups of District banks.
Stir In: Noninterest Income and Expense
District banks were also able to raise more income than before from noninterest sources—fiduciary (trust) activities, service charges on deposits, and various types of fee-generating activities, like loan processing fees and ATM usage. Such income continues to be much more important to large banks than to small ones. Indeed, the noninterest income ratio for the District's largest banks was about three times that for the smallest banks. In part, this is because large banks are much more likely than small banks to offer sophisticated products like trust and brokerage services.
Gains in noninterest income were not enough, however, to offset increases in noninterest expense. Despite efforts over the last few years to trim overhead, non interest expenses continue to rise. The largest component of noninterest expense is employee salaries and benefits; only the District's small banks were able to reduce this expense (the number of employees at small banks declined 4.1 percent in 1992). All banks, however, faced increases in deposit insurance premiums that varied with the perceived riskiness of the bank.1 The net result was no change in the net noninterest margin at the District's small banks and slight increases at mid-sized and large institutions, which depressed earnings.
Icing on the Cake: Lower Provisions and Securities Gains
While substantial increases in net interest margins were enough to ensure that 1992 would yield higher profit ratios than 1991, two additional items put the icing on the cake. The most important of these was the decline in provisions for loan and lease losses—the funds a bank sets aside to cover expected losses in the loan and lease portfolio. Lower provisions at banks of all sizes reflect improvements in asset quality, as nonperforming loans—consumer, commercial and real estate—declined throughout 1992. The improvement was greatest at small banks and least at large banks, probably because of the higher proportion of commercial real estate loans on the books of large banks. Such loans have had high delinquency rates the last several years.
Gains from securities sales provided a second finishing touch. Securities gains ratios rose by two basis points at the District's small and mid-sized banks and by nine basis points at large banks. Once again, the low interest rate environment provided a profitable opportunity for banks: low rates boosted the market prices of government and corporate bonds, and many banks chose to sell some of the bonds in their investment portfolios to cash in on these price increases. In addition to providing income, selling these bonds—especially those with long terms to maturity—can reduce a bank's exposure to interest rate risk.
The only other significant item on the income statement is income taxes. Income taxes as a portion of average assets increased at banks of all sizes in 1992. Taxable income increased because of declines in the proportion of tax-exempt assets on banks' books. (Banks, like other firms, pay taxes on most income and on capital gains from the sale of municipal and corporate debt and equity securities.)
Conclusion
Much of the banking industry's success in both the District and the nation in 1992 can be attributed to the economic environment. While sluggish economic growth continued to suppress loan demand, the low level of interest rates permitted banks to feast on high interest spreads and increases in the market value of their investment portfolios. At the same time, improved real estate markets and economic conditions led to improvements in asset quality that directly reduced banks' expenses, putting them in a good position to meet loan demand when it picks up. All told, the short-run picture of the banking industry looks appealing. Rising interest rates, however, could make life a little less sweet for bankers.
District Banks by the Numbers, 1992
Income Statement Ratios for Eighth District Commercial Banks, 1991 and 1992, by Asset size
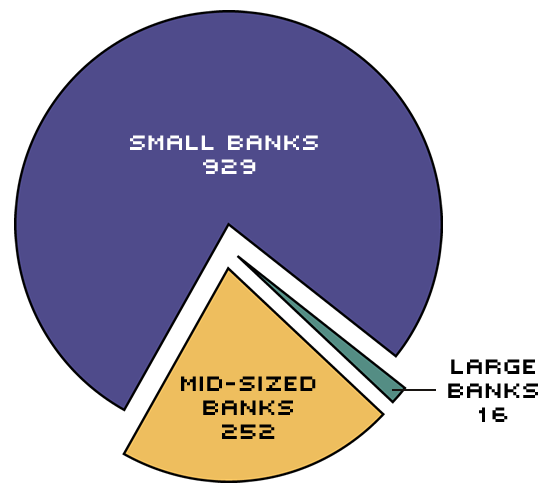
| Small banks (< $100 million) |
Mid-Sized Banks ( $100 million-$1 billion) |
Large Banks (> $1 billion) |
||||
|---|---|---|---|---|---|---|
| Income and Expenses | 1992 | 1991 | 1992 | 1991 | 1992 | 1991 |
| a. Loan interest income | 5.01 | 5.64 | 5.13 | 5.88 | 4.57 | 5.57 |
| b. Securities interest income | 2.54 | 2.80 | 2.23 | 2.30 | 1.84 | 1.80 |
| c. Other interest income | 0.24 | 0.43 | 0.22 | 0.37 | 0.37 | 0.69 |
| d. Total interest income (= a + b + c) | 7.79 | 8.86 | 7.58 | 8.55 | 6.78 | 8.06 |
| e. Total deposit expense | 3.57 | 4.93 | 3.36 | 4.59 | 2.53 | 3.73 |
| f. Total interest expense | 3.62 | 4.99 | 3.49 | 4.79 | 3.10 | 4.61 |
| g. NET INTEREST MARGIN (= d – f)1 | 4.18 | 3.88 | 4.08 | 3.76 | 3.68 | 3.46 |
| h. Total noninterest income | 0.63 | 0.59 | 0.96 | 0.95 | 1.81 | 1.79 |
| i. Total noninterest expense | 2.89 | 2.85 | 3.06 | 2.96 | 3.58 | 3.45 |
| j. NET NONINTEREST MARGIN (= h – i) | (2.26) | (2.26) | (2.10) | (2.01) | (1.77) | (1.66) |
| k. Gains on securities sales | 0.06 | 0.04 | 0.07 | 0.05 | 0.13 | 0.04 |
| l. Provision for loan and lease losses | 0.30 | 0.40 | 0.38 | 0.46 | 0.60 | 0.62 |
| m. INCOME BEFORE TAXES (= g + j + k - l) | 1.69 | 1.25 | 1.67 | 1.34 | 1.44 | 1.22 |
| n. Income taxes | 0.49 | 0.36 | 0.50 | 0.37 | 0.42 | 0.31 |
| o. Extraordinary items | 0.01 | 0.01 | 0.01 | 0 | 0.01 | 0 |
| p. NET INCOME (= m – n + o) or ROA | 1.21 | 0.91 | 1.19 | 0.97 | 1.03 | 0.91 |
NOTE: All ratios are as a percent of annual average assets. Numbers in parentheses are negative. Totals may not add due to rounding.
1 The ratios presented here under "net interest margin" do not conform to the usual definition of net interest margins because the denominator includes all assets, rather than just interest-earning assets. Removing noninterest-bearing assets from the denominator would add approximately 40 to 50 basis points to the ratios.
Endnotes
- See "FDIC Upholds Current Deposit Insurance and Thrifts," BNA's Banking Report, September 21, 1992, p. 379, for details on changes in FDIC premiums. [back to text]

Views expressed in Regional Economist are not necessarily those of the St. Louis Fed or Federal Reserve System.
For the latest insights from our economists and other St. Louis Fed experts, visit On the Economy and subscribe.
Email Us