


District Overview: Income Inequality Is Growing in the District, but Not as Fast as in the Nation
The evolution of national income inequality is a major topic in current economic discussions. In a recent speech, Federal Reserve Chair Janet Yellen described the issue as one of the most important of our time: "By some estimates, income and wealth inequality are near their highest levels in the past hundred years, much higher than the average during that time span and probably higher than for much of American history before then."1
Less discussed is the evolution of income inequality on a subnational level. Not all regions in the U.S. exhibit the same inequality patterns as the nation does. Using data from the annual March supplement of the Current Population Survey, we analyzed the long-term trends of income inequality in the Eighth District. We found that although inequality in the District has increased, it has done so at a slower pace than has occurred in the nation as a whole.2
There are several ways to measure inequality. The most common is in terms of income, but inequality can also be measured by consumption and by wealth.3 Each measure has different implications for the level of inequality found. In general, measuring inequality through wealth yields the most unequal distribution, while income inequality is slightly less unequal, and consumption inequality is even less unequal.4
This article focuses on income inequality, using total earnings and disposable income as the variables for analysis. We chose total earnings because this variable represents gross labor income—it excludes income earned from financial wealth, income from government transfers (such as welfare) and deductions due to income taxes. Disposable income is the amount individuals have left from all income sources after paying taxes and receiving government benefits. Comparing disposable income to total earnings can show how effective the government is at mitigating inequality.
Income Inequality in the District
Overall, income inequality has increased in the Eighth District. From 1979 to 2009, the income ratio of a person in the top 10 percent of the income distribution to that of a person in the bottom 10 percent has grown from 5.7 to 6.2.5 This means an individual at the top of the distribution now earns slightly more than six times as much as someone at the bottom. Moreover, the entirety of this increase is due to larger earnings in the top of the distribution.
Over the 30 years studied, income in the 90th percentile has grown by more than 8 percent in real terms, while income in the 10th percentile has remained essentially flat in those same inflation-adjusted terms. These numbers indicate that the top-echelon income earners are taking home more, but the rest of the population's purchasing power is about the same or even less than 30 years earlier.
Eighth District vs. U.S.
Clearly, income inequality has increased in the Eighth District, but how does this compare with the evolution of income inequality in the U.S.? Economists commonly use Gini coefficients to answer these types of questions. A Gini coefficient measures inequality across a distribution of individuals, giving a value between zero (expressing perfect equality) and 1 (expressing perfect inequality). The table shows the average Gini coefficients over two five-year periods for the U.S. and the Eighth District. In terms of inequality measured by annual earnings, inequality in the Eighth District rose 0.03 points, from 0.36 in the first period to 0.39 in the second period. In the U.S., inequality increased 0.05 points, from 0.36 to 0.41. By this measure, the U.S. and the Eighth District started at the same place in the beginning of our analysis but ended with income inequality for the nation higher than income inequality in the Eighth District.
Average Gini Coefficients for Annual Earnings and Disposable Income
| Eighth District | U.S. | |
|---|---|---|
| Earnings | ||
| 1979-1984 | 0.36 | 0.36 |
| 2004-2009 | 0.39 | 0.41 |
| Disposable Income | ||
| 1979-1984 | 0.33 | 0.34 |
| 2004-2009 | 0.40 | 0.41 |
SOURCES: Authors' calculations using data from the U.S. Census Bureau and the U.S. Bureau of Labor Statistics provided by Unicon Corp.
In terms of inequality measured by disposable income, the Eighth District has kept pace with the U.S. The Gini coefficients on disposable income have increased 0.07 points in both the U.S. and the District between the two periods. However, the absolute level of inequality in the Eighth District remains below the U.S. in both periods reported.6
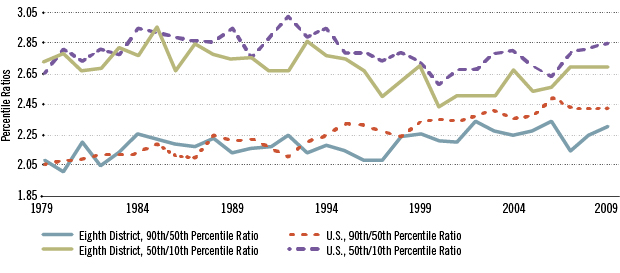
Another way to compare inequality over time and regions is to calculate ratios of various percentiles of the income distribution. For example, the 90th to 50th percentile ratio compares the income of a person who stands at the 90th percentile of the income distribution, that is, a top earner, to that of a person who stands at the 50th percentile of the distribution, that is, a middle-income earner. Figures A and B show the 90th to 50th and the 50th to 10th percentile ratios for earnings and disposable income in the Eighth District and the U.S. In 1979, the 90th to 50th percentile ratios for earnings and disposable income started out at about 2 in both the U.S. and the Eighth District.
A ratio of 2 means that the top-income earners in both the measures studied made about twice as much as the middle class. In the 30 years since, the ratios for the U.S. (dashed lines) have increased more rapidly than the ratios for the District. Both ratios appear to have followed a similar trend until the early 1990s, when the income inequality in the U.S. began to increase more rapidly than in the Eighth District. In 2009, the U.S. top-income earners were earning more than 2.4 times the middle class. In the District, these top individuals were earning about 2.3 times more.
In sum, income inequality is increasing primarily in the upper end of the distribution, between the top-income earners and the middle-income earners. Although the level of income inequality is higher in the lower end of the distribution, this level has not dramatically increased over the period studied. In the upper end of the distribution, an increasing trend is clearly visible.
Conclusion
Economists continue to debate the source of the increase in inequality in the past few decades. The above analysis shows that although income inequality in the Eighth District has increased, it has done so at a slower pace than in the nation as a whole. Moreover, despite the different paces of increase, both the U.S. and the Eighth District have experienced increased income inequality primarily in the upper end of the distribution.
Income Inequality Ratios for Total Earnings and Disposable Income
A) Percentile Ratios, Total Earnings
B) Percentile Ratios, Disposable Income
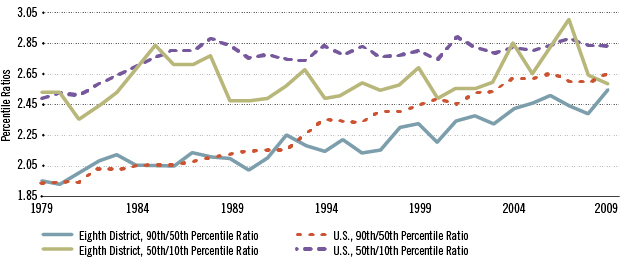
SOURCES: Authors' calculations using data from the U.S. Census Bureau and the U.S. Bureau of Labor Statistics provided by Unicon Corp.
Endnotes
- See Yellen. [back to text]
- There are some limitations when using data from the annual March supplement of the Current Population Survey. These data are somewhat limited at the subnational level. In particular, geographic identifiers do not follow the Federal Reserve district boundaries. For this reason, we compute measures of income inequality for the Eighth District by including individuals living in the following states at the time of the survey: Missouri, Arkansas, Mississippi, Tennessee, Kentucky, and Indiana. This is, therefore, an approximation to the population living in the Eighth District's territory. While part of the state of Illinois lies in the Eighth District, we decided to exclude it in the analysis since most of Illinois' population, including that of the city of Chicago, does not. [back to text]
- For more details on various measures of inequality in the U.S., see speech by St. Louis Fed President James Bullard to the Council on Foreign Relations on June 26, 2014, at https://www.stlouisfed.org/from-the-president/speeches-and-presentations/2014/income-inequality-and-monetary-policy. [back to text]
- See the study by Heathcote, Perri and Violante and the study by Ricketts and Waller. [back to text]
- We study the evolution of income inequality from 1979 to 2009 because of data availability. [back to text]
- The higher Gini coefficient for disposable income as compared to earnings doesn't necessarily mean the government hasn't been effective at mitigating inequality. Disposable income starts with earnings, then adds income from financial wealth and subtracts government transfers. Therefore, before government transfers take place, we would expect income to be more unequal than earnings. [back to text]
References
Heathcote, Jonathan; Perri, Fabrizio; and Violante, Giovanni L. "Unequal We Stand: An Empirical Analysis of Economic Inequality in the United States, 1967-2006." Review of Economic Dynamics, January 2010, Vol. 13, No. 1, pp. 15-51.
Ricketts, Lowell R.; and Waller, Christopher J. "U.S. Income Inequality May Be High, but It Is Lower Than World Income Inequality." The Regional Economist, July 2014, Vol. 22, No. 3. See https://www.stlouisfed.org/publications/regional-economist/july-2014/us-income-inequality-may-be-high-but-it-is-lower-than-world-income-inequality.
Yellen, Janet. Speech at the Conference on Economic Opportunity and Inequality at the Federal Reserve Bank of Boston on Oct. 17, 2014. See www.federalreserve.gov/newsevents/speech/yellen20141017a.htm.


Views expressed in Regional Economist are not necessarily those of the St. Louis Fed or Federal Reserve System.
For the latest insights from our economists and other St. Louis Fed experts, visit On the Economy and subscribe.
Email Us