


The Rise and (Eventual) Fall in the Fed's Balance Sheet
In response to the Great Recession, the Federal Open Market Committee (FOMC) approved several unconventional monetary policies intended to foster a more robust economic recovery. Of these policies, large-scale asset purchases (LSAPs), popularly known as "quantitative easing" or QE, led to the largest expansion of the Fed balance sheet since World War II. The FOMC has stipulated that the expansion of the Fed balance sheet is a temporary policy stance and that holdings will return to normal as the recovery progresses. Inflation pressures resulting from this expansion have been trivial thus far. However, a quickening economic recovery could provide incentives for banks to withdraw funds held as excess reserves at the Fed and inject them into the real economy. Given the significant amount of funds held as excess reserves, this increased lending might lead to inflation pressures inconsistent with the Fed's mandate of price stability. To prevent this scenario, the FOMC has several policy tools at its disposal to both control and eventually unwind the balance sheet.
The Fed's Balance Sheet Policies
The first round of LSAPs (QE1) began in March 2009 and ended one year later. Over the course of the program, the Fed purchased $1.25 trillion in mortgage-backed securities (MBS), $200 billion in federal agency debt (i.e., debt issued by Fannie Mae, Freddie Mac and Ginnie Mae to fund the purchase of mortgage loans) and $300 billion in long-term Treasury securities. The purchase of $1.45 trillion of MBS and agency debt helped to increase credit availability in private markets, revitalizing mortgage lending and propping up the beleaguered housing market. The purchase of $300 billion in long-term Treasuries was designed to put downward pressure on interest rates in general in order to bolster economic activity.
During the summer of 2010, fears mounted that the U.S. economy could fall into a deflationary outcome similar to that experienced by Japan.[1] Deflation, a decrease in the general price level of goods and services, is often associated with poor economic performance, such as that experienced by Japan since the late 1990s. To avoid this scenario, the FOMC put upward pressure on inflation through a second round of LSAPs (QE2). This program involved the purchase of $600 billion in long-term Treasury securities from November 2010 to June 2011 at a pace of $75 billion per month.
Following QE2, the risks of deflation and recession subsided. However, soft economic data indicated a struggling economic recovery vulnerable to negative shocks. Around the same time, the European Union was embroiled in a worsening sovereign debt crisis, which threatened to destabilize the second-largest economy in the world. To protect the U.S. economy against adverse shocks, the FOMC turned to the maturity extension program, popularly known as Operation Twist, a policy originally used by the central bank in 1961. Operation Twist involved the sale of short-term Treasury securities and an equal purchase of long-term Treasury securities. This put downward pressure on long-term interest rates while maintaining the same amount of securities on the Fed balance sheet. Operation Twist was started in September 2011 and was extended in June 2012 to continue through the end of 2012. In total, the FOMC purchased, as well as sold and redeemed, $667 billion in Treasury securities through the program, eliminating all holdings of securities with a maturity of one year or less. For comparison, about half of the portfolio fit this "one year or less" classification in July 2007, which was prior to the financial crisis.
Following Operation Twist, labor-market data continued to exhibit signs of a weaker-than-desired recovery. To engender a stronger labor market, the FOMC began a third round of large-scale asset purchases (QE3) in September 2012. The purchases initially involved $40 billion in agency MBS per month. However, after Operation Twist ended in December 2012, the FOMC added $45 billion in long-term Treasury securities to the monthly purchase. The QE3 program is state-contingent and open-ended, meaning economic conditions rather than a static end date will determine when the program concludes. State contingence affords the FOMC greater flexibility to adjust monetary policy if the economic recovery gains or loses strength. For example, at its December 2013 meeting, the FOMC reduced its monthly asset purchase for the first time, dropping the total purchase to $75 billion from $85 billion.[2] State-contingent forward guidance also applies to federal funds rate policy. An example of this is the FOMC's announcement in December 2012 that its federal funds rate target would remain between 0 and 0.25 percent while the unemployment rate remains above 6.5 percent, inflation is no more than 2.5 percent and long-term inflation expectations remain moderate.
Assessing the Proverbial Elephant in the Room
The LSAPs have collectively expanded the Fed balance sheet by close to $3 trillion from December 2007 to November 2013. That figure is nearly four times the prerecession average. However, viewing the balance sheet in absolute terms offers only one perspective, one that fails to take into account the relative size of the U.S. economy. In central banking, the natural size of a balance sheet is proportional to the size of the economy for which it is managed. Also, to judge our balance sheet we need to compare it with those of other credible central banks.
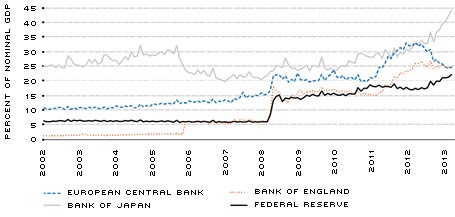
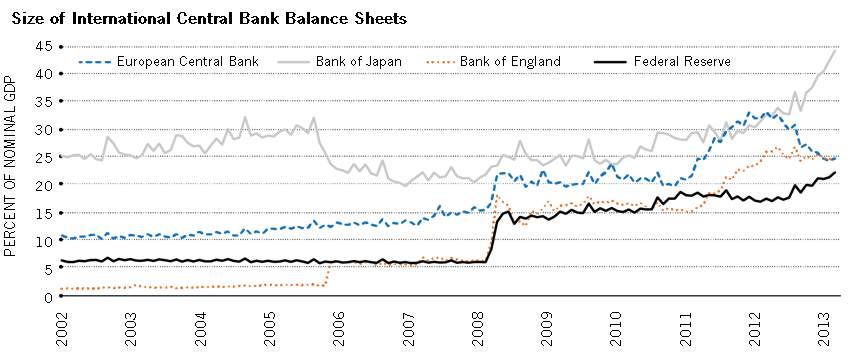
Figure 1 shows the values of four major central banks' balance sheets as a percentage of respective nominal gross domestic product (GDP). All major central banks conducted accommodative monetary policy in the wake of the Great Recession to counteract the global economic slowdown. (Many approved LSAPs similar to QE.)
The Federal Reserve, with a balance sheet worth 22.3 percent of nominal GDP, ranks lowest among its international counterparts. In contrast, the Bank of Japan's balance sheet is valued at 44.3 percent of Japanese GDP. While not featured here due to scaling, the Swiss National Bank's balance sheet increased to about 83 percent of Swiss GDP as it acted to defend the value of the Swiss franc from appreciating during the European debt crisis.[3] Trailing other central banks affords the FOMC some insight as to what limits may exist in terms of expanding the balance sheet. According to the empirical evidence observed so far, none of our central bank counterparts has hit a definitive adverse ratio.
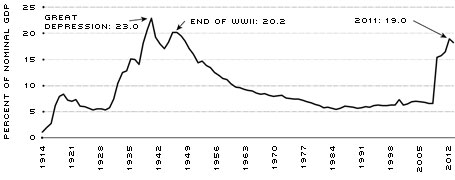
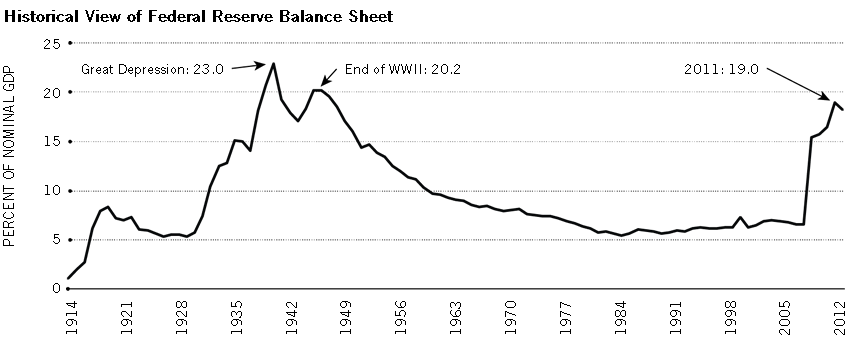
In addition to international comparisons, we looked back at our own history in terms of the size of our balance sheet. Figure 2 shows the relative value of the Fed balance sheet going back to the Fed's creation 100 years ago. The current value of the balance sheet is comparable to two periods in U.S. history. In 1940, during the Great Depression, the balance sheet reached its historic maximum of 23 percent of nominal GDP. In 1946, following World War II, the balance sheet rebounded to 20.2 percent. Thus, recent levels have been seen before during trying times in national history.
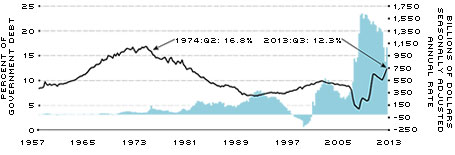
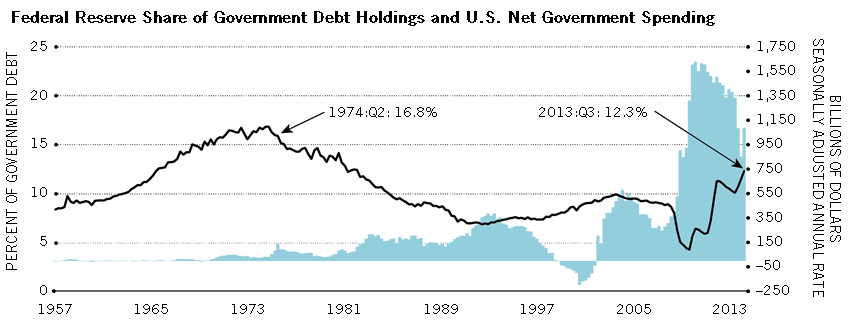
Critics of the LSAP programs have voiced concerns that the massive purchase of Treasury securities amounts to the Fed's financing the U.S. government's deficit spending, a phenomenon known as "monetizing the debt." If you assume this to be true, then the Fed's share of outstanding Treasuries should reach record levels in response to record deficit spending. Figure 3 charts the Fed's share of total outstanding Treasuries going back to 1957 along with U.S. government net spending. While the Fed's share of outstanding government debt has increased by about 4.3 percent since the fourth quarter of 2007, this share remains far below its 16.8 percent peak in the middle of 1974. While the FOMC has purchased a substantial share of U.S. Treasury securities in the pursuit of its monetary policy objectives, it has not done so with an explicit intention to support fiscal policy.
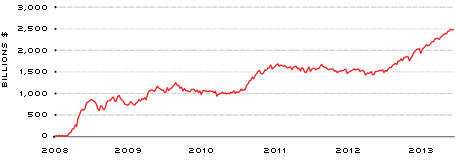
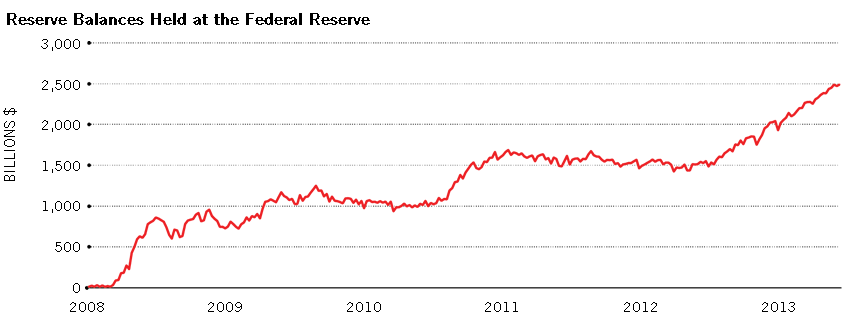
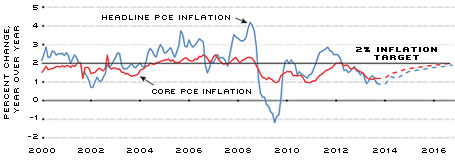
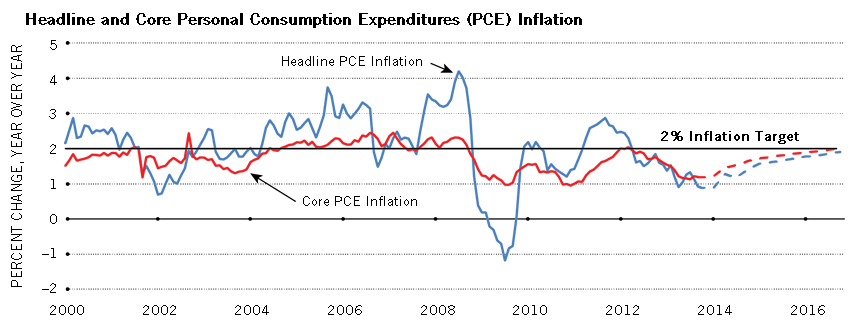
In tandem with the expansion of the balance sheet, reserve balances held by financial institutions at the Fed have reached historic levels. (See Figure 4.) These reserves are the result of the LSAP programs, whereby financial institutions were credited cash in the form of reserves in exchange for Treasury securities and MBS. This process is largely why inflation pressures have been subdued during the expansion of the balance sheet. As long as these balances remain in the form of excess reserves held by the Federal Reserve, they are isolated from the real economy and contribute negligible inflation pressures. This is supported by personal consumption expenditures (PCE) inflation data, as both headline and core inflation have averaged about 1.4 percent since the Great Recession began. (See Figure 5.) This is well below the FOMC's 2 percent target for inflation. However, as economic activity accelerates, financial institutions will have greater incentives to lend these excess reserves, and inflation pressures could manifest if reserves flow into the real economy. Fortunately, the FOMC has several tools that will allow it to pre-empt this scenario through winding down the balance sheet and/or freezing reserve balances in place. For more information about these tools, see below.[4]
Conclusion
The unconventional monetary policies conducted by the FOMC during and after the Great Recession have been instrumental in avoiding a depression and in supporting a recovery that has only gradually gained momentum. These policies have greatly expanded the Fed balance sheet, an expansion similarly seen during other defining moments in national history, as well as around the world, in response to the financial crisis. In the coming years, the FOMC will need to reconcile the extraordinary amount of excess reserves with a healthier economy—an economy that will have a greater demand for loanable funds. The FOMC has several tools at its disposal that will afford it significant control over excess reserves. That preparedness, combined with the credibility afforded an independent central bank, will allow the FOMC to take timely action in order to foster a stable monetary-policy transition.
Size of International Central Bank Balance Sheets
SOURCES: European Central Bank, Statistical Office of the European Communities, Bank of Japan, Cabinet Office of Japan, Bank of England, Office for National Statistics, Federal Reserve Board, Bureau of Economic Analysis/ Haver Analytics and authors' calculations.
Historical View of Federal Reserve Balance Sheet
SOURCES: Federal Reserve Board, Bureau of Economic Analysis, Historical Statistics of the United States/Haver Analytics.
NOTE: The lengthier historical time series featured in Figure 2 requires data of annual frequency. Therefore, the length of the time series does not match Figure 1, which uses monthly data. Annual data for 2013 were not available as of publication.
Federal Reserve Share of Government Debt Holdings and U.S. Net Government Spending
SOURCES: Federal Reserve Board, International Monetary Fund, Bureau of Economic Analysis, Treasury/Haver Analytics and author's calculations.
NOTE: For the right axis, positive values represent budget deficits while negative values indicate budget surpluses. The federal government has run record deficit spending following the recession. To finance this spending, it has issued Treasury securities. While the Fed's large-scale asset purchases (LSAPs) have involved significant purchases of these securities, they have not financed the majority of the debt expansion.
Reserve Balances Held at the Federal Reserve
SOURCES: Federal Reserve Board/Haver Analytics.
Headline and Core Personal Consumption Expenditures (PCE) Inflation
SOURCES: Bureau of Economic Analysis, Macroeconomic Advisers/Haver Analytics.
NOTE: Dashed lines indicate forecasts.
Endnotes
- See Bullard. [back to text]
- The $10 billion reduction consists of an equal $5 billion taper for both MBS and Treasury security purchases. [back to text]
- Swiss exports are heavily reliant on demand from the euro area. During the European debt crisis, investors flocked to the Swiss franc as a safe-haven currency and drove up the value of the franc significantly. This made Swiss exports far less competitive (declining at an annual rate of about 6 percent in the third quarter of 2011) and greatly diminished GDP growth (–2.9 percent annual rate during the same period.) In response, the Swiss National Bank purchased mass quantities of foreign currency to drive down the value of the Swiss franc. This is a great example of an LSAP program that involves both a different objective as well as a different asset. [back to text]
- For a thorough analysis of Fed exit strategy, see Kliesen. [back to text]
References
Bullard, James. "Seven Faces of 'The Peril.'" Federal Reserve Bank of St. Louis Review, September 2010, Vol. 2, No. 5, pp. 339-52.
Kliesen, Kevin L. "The Fed's Strategy for Exiting from Unconventional Policy: Key Principles, Potential Challenges." Federal Reserve Bank of St. Louis The Regional Economist, October 2013. See this online-only article at www.stlouisfed.org/publications/regional-economist/october-2013/the-feds-strategy-for-exiting-from-unconventional-policy-key-principles-potential-challenges.


Views expressed in Regional Economist are not necessarily those of the St. Louis Fed or Federal Reserve System.
For the latest insights from our economists and other St. Louis Fed experts, visit On the Economy and subscribe.
Email Us