


The Fed's Strategy for Exiting from Unconventional Policy: Key Principles, Potential Challenges
At the end of its Dec. 15-16, 2008, meeting, the Federal Open Market Committee (FOMC) voted to establish a range of 0 to 0.25 percent for the federal funds rate. This was a historic action. Prior to this decision, the FOMC had never set this target rate below 1 percent. However, monetary policymakers were already moving aggressively in other dimensions. Beginning in mid-September 2008, the Fed permitted the size of its balance sheet to expand rapidly. Now, five years later, the Fed’s balance sheet has increased to more than $3.5 trillion, or about 21 percent of nominal GDP.1 Historically, the Fed’s balance sheet averages about 6 percent of GDP; so, the expected return to “normal” will entail a significant reduction in the size of the balance sheet. In all likelihood, the Fed’s balance sheet will remain larger than normal by the time the Fed begins raising its short-term interest rate target. This outcome might prove problematic for the Fed if it dramatically reduces its net income that is remitted to the Treasury.
What Does a Normal Balance Sheet Look Like?
The large increase in the Fed’s balance sheet since 2009 stems primarily from its purchases of mortgage-backed securities (MBS) and U.S. Treasury securities. Officially, these purchases have been made primarily under three large-scale asset purchase (LSAP) programs.2 Table 1 shows a greatly simplified Federal Reserve balance sheet for December 2005 (a period arbitrarily defined as normal) and for August 2013. Prior to the financial crisis, the Fed’s assets were mostly comprised of its holdings of U.S. Treasury securities, and its liabilities were mostly Federal Reserve notes.
Table 1 shows that the size and composition of the Fed’s balance sheet changed dramatically during the period of the LSAPs. On the asset side, the Fed still had a large amount of Treasury securities in August 2013 ($2.02 trillion). However, in a sharp departure from past policies, it now holds a large amount of securities whose value is closely tied to developments in the housing market: federal agency securities and mortgage-backed securities (MBS).3 On the liability side, the Fed now has a much larger amount of deposits of commercial depository institutions ($2.33 trillion).
A Simplified Federal Reserve Balance Sheet (billions of dollars)
| Assets | Dec. 2005 | Aug. 2013 |
|---|---|---|
| U.S. Treasury Securities | $744.2 | $2,023.6 |
| Federal Agency Securities | 0.0 | 65.7 |
| Mortgage-Backed Securities | 0.0 | 1,291.3 |
| All Other Assets | 103.5 | 263.8 |
| Total Assets | $847.7 | $3,644.5 |
| Liabilities | ||
| Federal Reserve Notes | $759.2 | $1,160.5 |
| Deposits at Federal Reserve Banks | 21.7 | 2,329.4 |
| All Other Liabilities | 38.8 | 99.6 |
| Total Liabilities | $819.7 | $3,589.5 |
| Net (Capital Accounts) | $28.0 | $55.0 |
SOURCE: Federal Reserve H.4.1 Statistical Release.
Traditionally, the Fed’s policy actions are transmitted to the economy through its actions that affect the supply and, thus, the cost of funds that commercial banks (depository institutions) can lend to households and to businesses. Banks make loans (that is, they acquire assets) largely from the amount of funds they receive from depositors or other banks. In the case of the LSAPs, a bank sells an asset—such as a Treasury security—to the Fed, and the bank’s account at the Fed is credited. All else equal, this increases bank reserves and reduces the cost of funds available to banks.4 By changing the level of reserves, the Fed can influence the federal funds rate and the spread between bank borrowing and lending rates—which affects the willingness of banks to make loans.
As a consequence of LSAPs, there has been a roughly four-fold increase in the monetary base (the liability side of the Fed’s balance sheet).5 Noted economist Milton Friedman termed the monetary base “high-powered money” because it is the raw material for money creation—the process that fuels loan growth, which finances economic transactions such as the buying and selling of goods and services or financial assets. If this increase in the monetary base is permanent, then the likely outcome is a much higher price level with an accompanying surge of inflation. However, most economists believe higher inflation can be prevented if the Fed credibly promises to withdraw this excess liquidity before it has a chance to dramatically increase money growth and inflation expectations.6
The Exit Strategy
In his June 19, 2013, press conference, Federal Reserve Chairman Ben Bernanke discussed the process of “normalizing policy for the long run.” This process was initially outlined in a set of principles published in the June 2011 FOMC minutes. According to those principles, the multistep process would proceed along the following lines. First, the FOMC would cease reinvesting some or all of the proceeds from maturing MBS and Treasury securities that it holds on its balance sheet. Currently, when the security matures, the proceeds are used to purchase more Treasury securities or MBS.7 Second, the FOMC would modify its forward guidance on the future path of the federal funds target rate. Third, the FOMC would then begin to raise its federal funds target rate. Fourth, “sometime after” the first increase in the federal funds target rate, the FOMC would begin to sell assets. Finally, the process of returning to a normalized balance sheet, entailing sales of housing-related securities, would occur over a two- to three-year period. Bernanke reaffirmed these principles, but with one significant departure: The Fed will refrain from actively selling its MBS assets before they mature.8
Challenges of Unwinding Unconventional Policy
The Fed’s strategy for normalizing policy is complicated by two important considerations. First, by limiting the scope of asset sales (holding on to the Fed’s mortgage-related assets until they mature), the FOMC may have lengthened the time it takes to normalize its balance sheet. Second, the process of interest-rate normalization—that is, returning the intended federal funds rate target to its long-run level—may occur much sooner if the economy proceeds as the FOMC expects. Therefore, to prevent an unwanted surge of high-powered money into the banking system, the Fed will have to keep these reserves locked up, so to speak. There are many ways the Fed could do that, but the most discussed approach focuses on paying interest on reserves.9 As the economy strengthens, loan demand would be expected to increase. Accordingly, the interest rate on reserves must be high enough to discourage a level of bank lending that might cause markets to begin expecting higher inflation—and therein lies the source of several challenges.
The first challenge is that the Fed has never before implemented a policy on such a large magnitude. Accordingly, the Fed may unintentionally create some uncertainty in the market if it does not signal its intentions clearly. Since small changes in bank reserves can potentially generate much larger changes in money growth, the Fed may find it necessary to adjust the interest rate on reserves frequently in response to evolving economic conditions.10
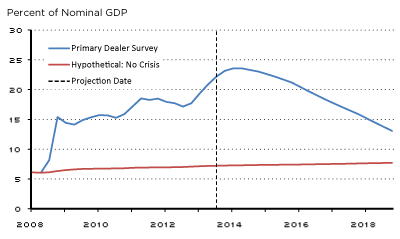
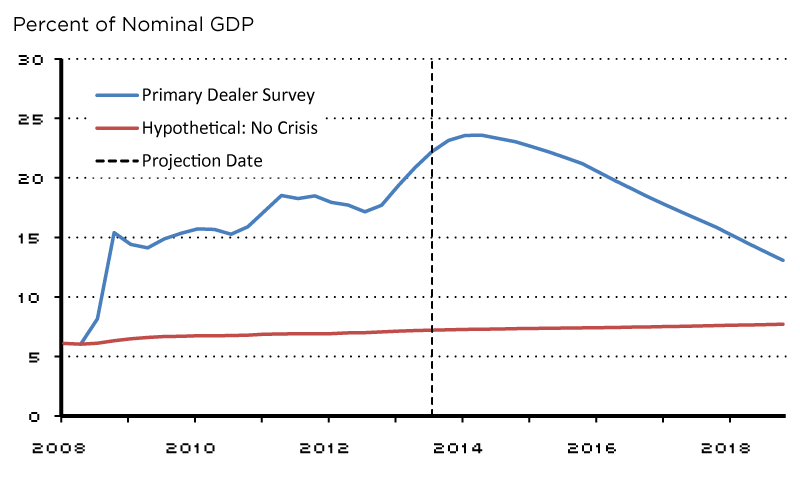
Another challenge stems from the likelihood of a steep reduction in the Fed’s net income that is expected to occur in an environment of rising market interest rates and a larger-than-average balance sheet. Figure 1 provides some assessment of the magnitude that is involved. From the first quarter of 2008 to the second quarter of 2013, the value of assets on the Fed’s balance sheet rose from about 6 percent of GDP to 21 percent of GDP. According to the July 2013 quarterly Survey of Primary Dealers, which is published by the Federal Reserve Bank of New York, the size of the Fed’s balance sheet (assets/GDP) is projected to peak at a bit less than 24 percent of GDP in the first quarter of 2014 and then slowly decline to about 13.5 percent by the fourth quarter of 2018 (the end of the survey’s projection period).11
The Projected Value of Assets on the Fed's Balance Sheet: Financial Market Expectations and a No-Financial Crisis Hypothetical Projection
SOURCE: Author's calculations.
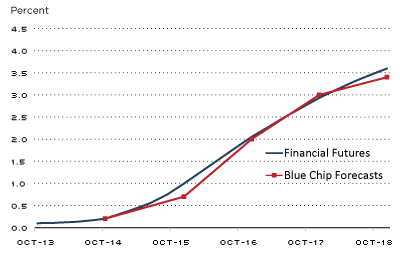
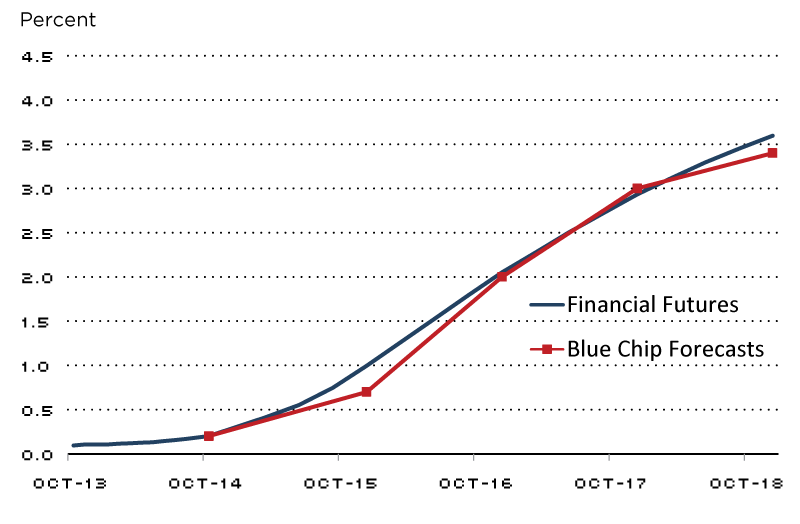
Figure 1 also shows a counterfactual (hypothetical) balance sheet projection. This hypothetical asset amount is assumed to be the level that would have occurred if the economy avoided the financial crisis. It is, thus, a proxy for a “normal-sized” balance sheet; it is assumed that Federal Reserve assets increased by 6 percent per year since 2007. At the end of the projection period (December 2018), the gap between what is expected (Primary Dealer Survey) and what might be considered “normal” is roughly $1.15 trillion, or 5.4 percent of nominal GDP. However, Figure 2 shows that financial market participants and Blue Chip forecasters expect the Fed’s short-term interest rate target to normalize much quicker, nearing its long-term average by the end of 2018. This level is also consistent with the FOMC’s quarterly long-range economic projections.
Expected Federal Funds Rates Estimated from Financial Futures and the Blue Chip Consensus Forecast for 3-Month T-Bill Rates
SOURCE: Financial futures as of Oct. 1, 2013, and October 2013 blue chip forecasts.
As discussed in papers published by several Federal Reserve economists and others, paying financial institutions a market interest rate on a large level of reserves balances will probably dramatically reduce the Federal Reserve’s annual distributions (remittances) to the U.S. Treasury.12 Briefly, each year the Federal Reserve System remits to the Treasury the excess of its earnings after expenses. This amount averaged $82 billion per year from 2010 to 2012. According to a recent New York Fed report, distributions are expected to average about $90 billion a year from 2013 to 2015. Since Federal Reserve expenses are relatively stable and grow relatively slowly over time, the expected change in distributions will depend importantly on the Fed’s earnings.13 However, as discussed in another Federal Reserve paper (Carpenter et al.), under certain scenarios these remittances could become zero for several years. Whether this outcome occurs depends on many things, such as the size of the balance sheet, the level of market interest rates and whether the Fed is forced to sell a portion of its Treasury securities at a loss.
Reduced remittances should have no impact on the Fed’s ability to conduct monetary policy. Still, some economists and Federal Reserve officials worry that it may diminish the central bank’s standing with the public in an era of heightened sensitivities about the federal budget deficits.14 However, this concern may be minimized if the Fed is successful in reducing the size of its balance sheet and the economy eventually transitions to its long-run sustainable rate of growth without an upsurge in inflation.
Endnotes
- Prior to the collapse of Lehman Brothers on Sep. 16, 2008, the liability side of the Fed’s balance sheet totaled $885 billion, which was about 6.2 percent of nominal GDP at the time. The liability side of the Fed’s balance sheet is mostly comprised of currency (Federal Reserve notes) and commercial bank deposits at the Federal Reserve. Together, these two series are known as the monetary source base. [back to text]
- LSAPs are one aspect of unconventional policy. The second component is termed forward guidance. The latter policy is the process of communicating to the public and financial markets the FOMC’s plans for setting the federal funds rate target over the next few years. By signaling its future intentions, the FOMC hopes to influence the path of longer-term interest rates. This article will ignore this aspect of unconventional policy. [back to text]
- Federal agency securities are direct obligations (debt) of the housing-related government-sponsored enterprises: Fannie Mae, Freddie Mac and the Federal Home Loan banks. These government-sponsored enterprises (GSEs) issue agency debt to fund purchases of residential mortgage loans made by commercial banks and thrifts, as well as other financial lenders. These loans are then bundled into mortgage-backed securities in a process known as securitization. The Fed’s holdings of MBS in 2012 were mostly 30-year securities issued and guaranteed by Fannie Mae, Freddie Mac and Ginnie Mae. See Domestic Open Market Operations during 2012, the annual report issued by the Markets Group of the Federal Reserve Bank of New York (www.newyorkfed.org/markets/annual_reports.html). [back to text]
- Bank reserves are the sum of cash that banks have in their vaults (which is relatively small) and funds on deposit at their Federal Reserve district bank. In July 2013, the Federal Reserve amended Regulation D, which established a “penalty-free band” around each bank’s reserve balance requirement. Prior to the change in Regulation D, the Fed used the concept of excess reserves, defined as the amount of funds that exceeded the balance maintained to satisfy a reserve requirement. However, the change in Regulation D eliminated the traditional concept of excess reserves. For more information, see www.federalreserve.gov/releases/h3/h3_technical_qa.htm. [back to text]
- The monetary base is the sum of commercial banks’ deposits at the Fed plus the amount of currency in circulation. In July 2013, the monetary base totaled $3.2 trillion. [back to text]
- See Anderson, Gascon and Liu; and Gavin. [back to text]
- These proceeds are the dollar amount of the face value (or par value) of the maturing bond. Thus, the Fed earns interest while it holds the securities, and then the face value of the bond is redeemed at maturity by the issuer. [back to text]
- See www.federalreserve.gov/mediacenter/files/FOMCpresconf20130619.pdf. [back to text]
- Congress gave the Fed the authority to pay interest on reserves in October 2008. [back to text]
- See Chari. [back to text]
- The projections for nominal GDP are the consensus forecasts for real GDP growth for 2013-2015 from the August 2013 Federal Reserve Bank of Philadelphia Survey of Professional Forecasters and the midpoint of the central tendency of the projections for long-run real GDP growth published in the June 2013 Summary of Economic Projections of FOMC members. To get nominal GDP growth, I added a 2 percent inflation forecast, which is the FOMC’s long-run inflation target. [back to text]
- See Carpenter et al., the annual report issued by the Markets Group of the Federal Reserve Bank of New York cited in endnote 5, and Greenlaw et al. [back to text]
- From an accounting perspective, the Fed’s net income available for remittance to the Treasury is its interest income less the sum of: (1) interest payments on reserves; (2) operating expenses; (3) net capital losses; (4) dividend payments on capital; and (5) contributions to capital surplus. [back to text]
- See Plosser, Thornton and Greenlaw. [back to text]
References
Anderson, Richard G.; Gascon, Charles S.; and Liu, Yang. “Doubling Your Monetary Base and Surviving: Some International Experience.” Federal Reserve Bank of St. Louis’ Review, November/December 2010, Vol. 92, No. 6, pp. 481-505.
Bernanke, Ben S. “Federal Reserve’s Exit Strategy.” Before the Committee on Financial Services, U.S. House of Representatives, Washington, D.C., March 25, 2010.
Carpenter, Seth B.; Ihrig, Jane E.; Klee, Elizabeth C.; Quinn, Daniel W.; and Boote, Alexander H. “The Federal Reserve’s Balance Sheet and Earnings: A Primer and Projections.” Finance and Economics Discussion Series, 2013-01, Board of Governors of the Federal Reserve System.
Chari, V.V. “Thoughts on the Federal Reserve’s Exit Strategy.” Federal Reserve Bank of Minneapolis Economic Policy Paper 10-1, March 2010.
Gavin, William T. “More Money: Understanding Recent Changes in the Monetary Base.” Federal Reserve Bank of St. Louis’ Review, March/April 2009, Vol. 91, No. 2, pp. 49-59.
Greenlaw, David; Hamilton, James D.; Hooper, Peter; and Mishkin, Frederic S. “Crunch Time: Fiscal Crises and the Role of Monetary Policy.” U.S. Monetary Policy Forum, New York City, Feb. 22, 2013.
Plosser, Charles I. “Reconsidering EXIT.” Remarks before Monetary Policy in a Global Setting: China and the United States, a conference sponsored by the Federal Reserve Bank of San Francisco, the Federal Reserve Bank of St. Louis and the National Institute for Fiscal Studies at Tsinghua University, Beijing, China, April 16, 2013.
Thornton, Daniel L. “A Perspective on Possible Fed Exit Strategies.” Federal Reserve Bank of St. Louis’ Economic Synopses, 2013, No. 21.

Views expressed in Regional Economist are not necessarily those of the St. Louis Fed or Federal Reserve System.
For the latest insights from our economists and other St. Louis Fed experts, visit On the Economy and subscribe.
Email Us