


District Overview: Eighth District Fares Better than Nation in Job Losses
It is no secret that the recent recession has hit labor markets hard. From December 2007 to October 2009, the U.S. economy lost more than 7 million jobs, a decline of 5.3 percent in total employment. In contrast, during the 2001 recession, the U.S. economy lost 1.5 million jobs, or 1.2 percent of total employment. Furthermore, the U.S. labor market has yet, perhaps, to hit the bottom. After the five previous recessions, it took an average of about 25 months to return to full employment, with the shortest return following the 1980 recession (10 months) and the longest return to full employment following the 2001 recession (46 months). On the plus side, in this latest recession, the four largest Metropolitan Statistical Areas (MSAs) of the Eighth District—St. Louis, Little Rock, Louisville and Memphis—performed somewhat better than the nation.
Between December 2007 and October 2009, each of the four MSAs in the Eighth District experienced a lower decline in total employment than the nation as a whole.1 Little Rock, with a 1.5 percent decline, lost the fewest jobs as a percent of total employment, followed by St. Louis (–3.9 percent), Memphis (–3.9 percent) and Louisville (–4.3 percent). These cities represent just 1.6 percent of total jobs lost during the current recession, or just over 100,000 jobs.2
More surprising was the mix of job losses. While the latest recession fueled the long-term trend in the loss of manufacturing jobs, it also increased job losses in sectors that are typically considered recession-proof, such as information and financial services. A sector-by-sector comparison between the four largest Eighth District MSAs and the U.S. reveals that each MSA performed better than the nation in percentage of jobs lost between December 2007 and October 2009 for the following categories: resources, mining and construction; manufacturing; financial services; and professional and business services.3 Furthermore, each MSA experienced higher growth than the U.S. for government services during this same time period. In contrast, each MSA also performed worse than the U.S. in certain industries. Both Louisville and Little Rock experienced a greater decline than the nation in trade, transportation and utilities, while Memphis experienced a sharper decline in information services. Finally, both Memphis and St. Louis experienced a greater decline in leisure and hospitality services than the U.S. for the December 2007 to October 2009 period.
The accompanying chart presents changes in employment for the period October 2008 to October 2009. Similar to the experience since the start of the recession, each MSA was below the nation in percentage of jobs lost for most categories during this time period. Furthermore, each MSA began to see stronger job performance (determined by fewer jobs lost relative to the nation and other Eighth District MSAs, or by job growth) than the U.S. for those industries with the highest relative share of employment.
Employment Growth
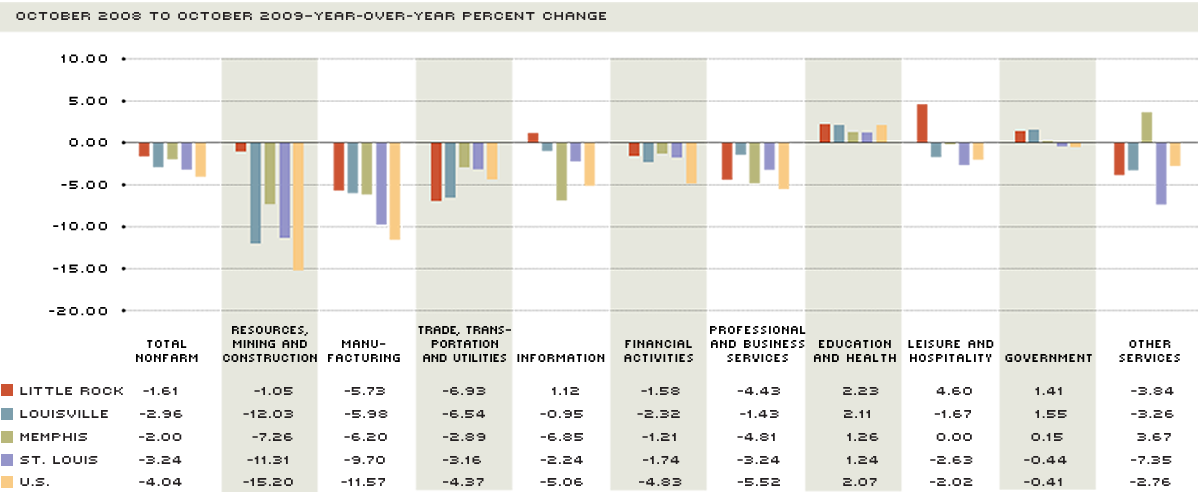
SOURCE: Bureau of Labor Statistics and authors' calculations
Little Rock Zone
Little Rock fared the best among Eighth District MSAs during the recent recession. It was the last to lose jobs over previous year's levels. November 2008 marked the first month since November 2002 that the Little Rock metropolitan area experienced a decrease in year-over-year payroll employment. Furthermore, between October 2008 and October 2009, Little Rock experienced the smallest decrease in year-over-year job losses of the four metro areas. Payroll employment fell 1.6 percent in the Little Rock area from October 2008 to October 2009—well below the national experience.
Little Rock experienced the largest year-over-year job declines in the trade/transportation/utilities (–6.9 percent), manufacturing (–5.7 percent), professional and business services (–4.4 percent) and other services (–3.8 percent) sectors. These losses were partly offset by gains in the leisure/hospitality (4.6 percent), education/health (2.2 percent), information (1.1 percent) and government (1.4 percent) sectors.
In October 2009, Little Rock had the highest concentration of employment, as compared with the other three District MSAs, in the aforementioned industries of growth, with the exception of leisure/hospitality. Government services made up 20.5 percent of the total employment in Little Rock, information services made up 2.6 percent, and education and health services represented 14.6 percent, second only to St. Louis, a city with 16.5 percent employment in this sector.
Within the Little Rock Zone (a Fed demarcation), Fort Smith, Ark., and Texarkana, Ark., posted year-over-year job declines of –1.7 and –2.1, respectively, both in excess of Little Rock's. In Fayetteville, Ark., the decline was 1.5 percent.
Louisville Zone
From October 2008 to October 2009, payroll employment in the Louisville area dropped 3 percent. Many of these lost jobs were in goods-producing industries. More than 16 percent of the Louisville work force is employed in goods-producing industries, the highest proportion among the four major metro areas in the District. In these industries, the Louisville area shed 8 percent of the jobs over the past year, largely due to a 12 percent decline in resources/mining/construction jobs.
Louisville also experienced significant job loss in the trade/transportation/utilities
(–6.5 percent), professional/business services (–1.4 percent) and the other services (–3.3 percent) sectors. Of the four metro areas, Louisville posted the largest year-over-year decline in the finance sector, losing 2.3 percent of total jobs. Louisville experienced job growth in both the government and education/health sectors, consistent with other areas in the District.
Evansville, Ind., and Clarksville, Tenn., two smaller metro areas in the Louisville Zone, experienced slightly smaller year-over-year job losses (–3.2 percent and –2.9 percent, respectively) than the Louisville area did. Job growth declined 5.7 percent in Bowling Green, Ky.
Memphis Zone
Unlike the other three major metro areas, where employment did not start to decrease over previous year's levels until several months into the recession, Memphis experienced year-over-year payroll employment decreases throughout most of 2008 and 2009. More recently, the year-over-year job loss was subdued in the Memphis area compared with other MSAs. From October 2008 to October 2009, nonfarm employment decreased 2 percent in the Memphis area.
Memphis employs a relatively large share of its work force in the trade/transporta-
tion/utilities sector. With greater than 26 percent of the Memphis work force in this industry, the 2.9 percent year-over-year decrease in payroll employment within this sector from October 2008 to October to 2009 contributed significantly to the overall payroll employment decline. Job losses in excess of the U.S. experience occurred in the information sector (–6.9 percent). Memphis also experienced significant job loss in the professional/business services sector (–4.8 percent). In contrast, the Memphis region experienced job growth in the education/health services sector (1.3 percent) and the other services sector (3.7 percent). Memphis was the only one of the four major MSAs in the District to add jobs in the other services sector.
Jackson, Miss., a smaller MSA in the Memphis Zone, experienced a 3.7 percent decrease in year-over-year employment.
St. Louis Zone
Over the past year, St. Louis experienced the largest year-over-year decline in nonfarm employment among the four big cities at 3.2 percent. As the District's largest MSA, St. Louis' economy most closely resembles the national economy. In both the St. Louis economy and the national economy, 14 percent of the work force is employed in goods-producing industries, while 86 percent is employed in service-providing industries. Similar to the U.S. experience, job losses in the St. Louis area were most heavily concentrated in goods-producing industries, in which more than 20,000 jobs were lost since the previous year. While other large metro areas in the District lost manufacturing jobs at roughly half of the 11.6 percent rate of decrease for the nation, St. Louis lost 9.7 percent of its manufacturing jobs since October 2008.
Job losses in the St. Louis region were not isolated to goods-producing industries. In the year ending October 2009, the St. Louis metro area lost jobs in every industry category except education and health services, in which the number of jobs increased by 1.2 percent. St. Louis lost a significant percent of total jobs in the other services (–7.4 percent), business services (–3.2 percent), trade/transportation/utilities (–3.2 percent) and leisure/hospitality services (–2.6 percent) sectors. Columbia, Mo., and Springfield, Mo., two smaller MSAs in the St. Louis Zone, experienced smaller year-over-year percentage job loss (–1.3 percent and –0.9 percent, respectively) than the St. Louis area did. In Jefferson City, Mo., year-over-year employment fell at roughly the same pace as in the St. Louis area.
Conclusion
Across the Eighth District, the latest recession impacted each of the four major MSAs in a different manner. While the first half of the recession marked sharp job losses in a broad number of categories, particularly in sectors with the largest share of employment, the past year saw each MSA return to its core strength, as defined by employment share.4 Within each sector, the MSA with the highest employment share performed the best, or near the best, in terms of percent of jobs lost. As the nation moves toward recovery, these sectors will probably assume a major role in leading each MSA back to full employment.
Endnotes
- October 2009's data were the most current data available as of mid-December. [back to text]
- As of the 2008 population census, St. Louis, Memphis, Little Rock and Louisville represented 1.98 percent of the total U.S. population. [back to text]
- As of mid-December, the NBER had yet to officially declare the end of the 2007 recession. [back to text]
- By MSA: Little Rock has the highest employment share and strongest year-over-year employment change in resources/mining and construction, and information services. Louisville has the highest employment share and second strongest year-over-year employment change in manufacturing. Memphis has the highest employment share and strongest year-over-year employment change in trade/transportation and utilities. St. Louis has the highest employment share and the second strongest year-over-year employment change in professional and business services. [back to text]

Views expressed in Regional Economist are not necessarily those of the St. Louis Fed or Federal Reserve System.
For the latest insights from our economists and other St. Louis Fed experts, visit On the Economy and subscribe.
Email Us