Deficits, Debt and Looming Disaster: Reform of Entitlement Programs May Be the Only Hope
For the fiscal year 2008, the federal government’s deficit totaled $455 billion, the largest ever for a single year. In the final days of the fiscal year, which ended Sept. 30, the total federal debt rose above $10 trillion for the first time. Forecasts for 2009 anticipate an even larger deficit.1 As a new president and Congress take office, government deficits and the public debt will undoubtedly be a factor in economic policy discussions, especially in light of ongoing financial uncertainty and economic weakness.
From an economic perspective, the size of the deficit and debt per se are not necessarily as important as the underlying policies of spending and taxation. By their very nature, deficits reflect an imbalance between expenditures and receipts. Such imbalances need not be a concern and might, in fact, be desirable under some circumstances. And while rising government debt is often associated with direct economic costs, including higher interest rates and lower rates of private investment, evidence on the significance of these effects is mixed.
Nevertheless, when deficits are part of a fundamental structural imbalance in the long term, they signal a need for serious attention and reform. In a long-run fiscal analysis of U.S. federal government programs, this is demonstrably the case.
Government Accounting
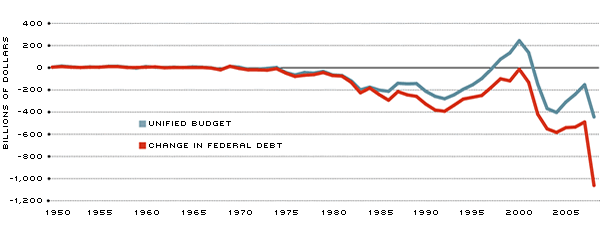
The top panel of Figure 1 shows two measures of the federal deficit. The blue line is the official measure reported by the government—$455 billion for fiscal 2008. The red line tracks the change in the total outstanding national debt from year to year. By this measure, the deficit exceeded $1 trillion in 2008.2 Note that the reported unified budget showed a surplus in 1998 through 2001; however, the change in the national debt has recorded red ink in every fiscal year since 1969. The difference between these two measures primarily reflects the treatment of the Social Security trust funds.3
By conventional accounting standards, the deficit is equal to the difference between total government spending and total revenues received, over a particular period of time. The debt equals the sum of previously accumulated deficits (or surpluses), plus interest accrued. When it comes to government, however, the accounting is slightly more complicated.
The spending and taxing policies of the federal government are classified into “on-budget” and “off-budget” categories. Those activities that are considered off-budget include the Postal Service fund and, more important, Social Security. The officially reported deficit is a “unified budget,” which includes the revenues and expenditures of these off-budget activities. Because the Social Security trust funds are currently running large surpluses, their inclusion has the effect of lowering the reported deficit. For example, in 2008 the on-budget deficit was $638 billion, while the off-budget surplus was $183 billion (due primarily to the Social Security trust fund). As a result, the unified budget deficit was $455 billion.
A similar dichotomy applies to the measurement of the national debt: Total public debt stood at $10 trillion at the end of fiscal 2008, but debt “held by the public” was $5.8 trillion. The difference is attributable to $4.2 trillion held in government trust funds and other intragovernmental accounts, of which $2.4 trillion was held by the Social Security trust funds.
As long as the balances in the Social Security trust funds are increasing, the on-budget deficit is partly offset by off-budget surpluses. When Social Security benefit payments begin exceeding revenues—which latest estimates suggest will begin in 2017—the off-budget components will add to the overall unified budget shortfall. (It will be interesting to see if the federal government continues to report the unified budget figures when this is the case.)
When the trust funds begin to be drawn down, the government will be faced with the need to borrow from the public in order to pay the obligations of the debt currently held in the trust funds. This will result in an increase in the debt held by the public, with no change in the total outstanding debt. In this sense, the total debt might better represent the long-term obligations of current government programs. In fact, as will be discussed later, a proper accounting of the long-term obligations of federal entitlement programs is far greater than the value of government IOUs in the Social Security trust funds.
Relative Size Matters
Although both the deficit and debt for fiscal 2008 were the largest on record in dollar terms, putting these figures in proper perspective is important: A more appropriate evaluation compares the deficit and the debt with national income. In the same sense that the manageability of a household’s debt depends on income (the ability of the household to make payments), evaluating the size of the government’s debt should be gauged against the size of the national economy.
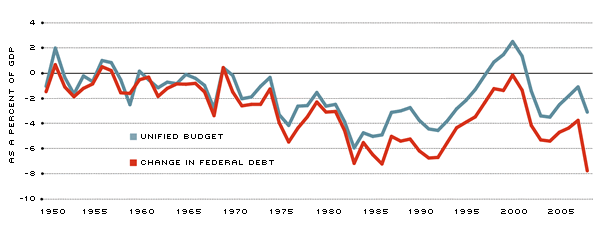
When expressed as a percent of GDP, as shown in the lower panel of Figure 1, recent deficits have not been exceptionally large. In fact, official deficits in the mid-1980s were nearly twice as large as the 3.2 percent of GDP recorded for 2008. Even using the alternative measure, last year’s change in the national debt amounted to 7.6 percent of GDP—only slightly greater than the 7.3 percent of GDP registered in 1986.4
Similarly, the $10 trillion national debt represents 69.5 percent of GDP—only slightly higher than the previous peak of 67.3 percent of GDP that was reached in 1996. Netting out intragovernmental holdings, debt held by the public in 2008 represented 40.3 percent of GDP, well below a previous peak of 49.4 percent in 1993.5
U.S. government debt is also not particularly large compared with that of other countries. In 2007, France’s government debt amounted to approximately 70 percent of GDP, Italy’s debt-to-GDP ratio was nearly 120 percent and Japan’s was over 170 percent.
Put in perspective, current deficits and debt levels are high, but not unprecedented. Should this red ink be a cause for concern?
Economic Impact of Deficits
In principle, deficits can serve a useful role by providing the ability to smooth the path of distortionary taxes over time, particularly over the business cycle. Longer-term deficits can be justifiable if they finance long-term expenditures (as with an individual who finances the purchase of a home) or if they are expected to pay off in higher national income in the future (as an investment). In a growing economy, even a permanently increasing deficit (if it is not increasing too fast) is sustainable in the long run.
It is often argued that government deficits, particularly longer-term deficits, impose a direct economic cost. A conventional Keynesian analysis of this effect begins from the fundamental national income accounting relationship that total domestic investment is equal to national savings, which includes the total of saving (or dissaving) by consumers, business and government. When the government runs a deficit, the borrowing needed to finance the shortfall diverts the private savings that would otherwise flow into investment. One of the expected manifestations of this “crowding out” effect is that government deficits, by increasing the competition for loanable funds, put upward pressure on interest rates.
This need not be the case, however. A theoretical construct that often serves as a baseline for evaluating the effect of deficits is known as “Ricardian equivalence.” In a closed economy with rational, forward-looking consumers, Ricardian equivalence suggests that deficits may have no effect at all. For instance, suppose the government were to implement a lump-sum tax cut, financing the resulting budget shortfall by borrowing from the public, with the resulting debt to be repaid in the future with a tax increase. Rational consumers would be expected to increase their savings in anticipation of higher future taxes, which would be needed to pay off the debt. The increase in government dissaving would be met by an increase in private sector saving, leaving overall national savings unchanged. With no change in the balance between national savings and investment demand, there would be no upward pressure on interest rates.
The conditions under which Ricardian equivalence holds—even from a theoretical perspective—are quite restrictive; so, it is unlikely to be a literal description of the impact of deficit financing on the economy. Nevertheless, it serves as a baseline for evaluating the relevance of crowding out effects that might be present if, for example, consumers are myopic about their own future tax burden or fail to consider the welfare of future generations, or if credit-market imperfections prevent them from responding optimally to government deficits.
In this regard, the economic relevance of crowding out—and its consequent effect on interest rates—is an empirical matter. As the deficit has increased in both size and public prominence over the past quarter-century, there has been a deluge of research on the subject. One review of the literature in 2004 by William Gale and Peter Orszag reported on a total of 66 previous analyses of the topic. Of these, 33 found significant effects of budget deficits, while 33 found insignificant or mixed effects. Gale and Orszag went on to conduct their own analysis, finding significant non-Ricardian effects: They suggest that a deficit increase amounting to 1 percent of GDP lowers national savings by 0.5 to 0.8 percent and that expected future deficits raise long-term interest rates by 25 to 35 basis points.
These findings have been controversial, however. In fact, another paper circulating at the same time by Eric Engen and Glenn Hubbard suggested that the debt, rather than the deficit, was the appropriate measure to consider. They found that a 1 percent increase in the debt-to-GDP ratio led to an increase in interest rates of only four to five basis points.
Recent experience has renewed skepticism about the effect of government deficits on interest rates. As the U.S. government deficit and debt have risen sharply over the past few years, long-term interest rates remained abnormally low relative to short-term rates. One factor that has evidently contributed to this phenomenon—not explicitly considered under the conventional Keynesian view or in the Ricardian-equivalence analysis—is the effect of savings coming into this country from abroad. The increasing demand for borrowing by the U.S. Treasury in recent years has been met with a substantial foreign inflow. (See below.) Even if U.S. residents are non-Ricardian in their behavior, the demand for U.S. Treasury securities by foreigners is likely to have mitigated upward pressure on interest rates that might otherwise have been observed.
A Demographic Time Bomb
While the immediate impacts of government deficits and debt are a matter of some controversy, most economists agree that the long-term fiscal outlook for the U.S. requires serious attention. The retirement of the Baby Boom generation and a slowing rate of growth in the labor force will create a demographic time bomb in which entitlement growth threatens to swamp available resources.
As mentioned earlier, the Social Security trust funds are projected to begin running down in 2017. By 2041, they are expected to be depleted.6 One way of measuring the long-run shortfall is to estimate the present value of unfunded obligations, that is, to estimate how much money would be needed, in today’s dollars, to pay for future promises in excess of expected tax revenues. In the case of Social Security, the U.S. Treasury estimates that paying promised benefits through the year 2081 would require $6.8 trillion, in addition to taxes collected under current law.7
The situation is even more dire when we consider health-care costs. The unfunded obligations of Medicare parts A and B amount to a present value of $25.7 trillion. Medicare Part D (prescription drug coverage) adds another $8.4 trillion. All told, the shortfall for government social insurance programs comes to a present value of $40.9 trillion. This is the government’s official estimate—some private sector economists suggest that the total burden is even greater. Economist Lawrence Kotlikoff has recently estimated the total unfunded liabilities of current federal programs at $70 trillion.8
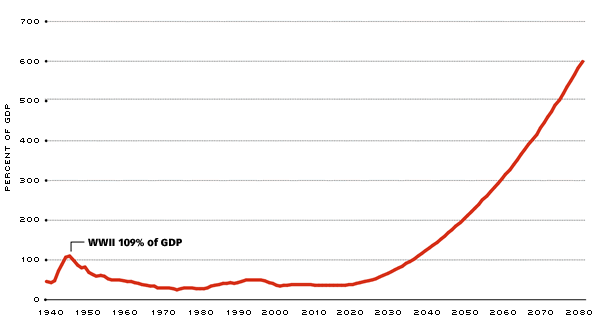
Figure 2 displays recent forecasts from the Government Accountability Office, illustrating the budget implications of these trends. The upper panel shows accelerating deficits over the next seven decades. Assuming revenues held constant at the historical average of 18 percent, these projections show the deficit rising to over 40 percent of GDP by 2080. The lower panel of Figure 2 shows the implications for the federal debt: an exponential rate of increase that reaches over 600 percent of GDP by 2080. This would far exceed any level of government borrowing in history.
These projections are unlikely to actually occur. The trends are unsustainable. Long before reaching such unprecedented level of borrowing, there would surely be a crisis of confidence among U.S. creditors, both domestic and foreign.
Current measures of the federal deficit and the national debt, as dismal as they might appear, fail to reflect full consequences of current-law fiscal policy. The unfunded future liabilities of government entitlement programs imply rising deficits and a ballooning public debt far larger than today’s shortfalls. And debates about the immediate economic impact of government deficits on private savings and interest rates, while of academic interest, fail to address the full importance of these long-run consequences. Fundamental reform of entitlement programs is critical for putting U.S. fiscal policy on a long-run sustainable path.
Figure 1
Federal Surplus/Deficit, 1950-2008


SOURCE: Economic Report of the President and Monthly Treasury Statement
The unified budget deficit/surplus figures represent the consolidated on-budget and off-budget balances as officially reported. The change in federal debt is the change in gross federal debt from one year to the next (with sign reversed).
Figure 2
Budget Projections, 1970-2080
Revenues and Expenditures

Debt Held by the Public

SOURCE: GAO, “A Citizen’s Guide to the 2007 Financial Report of the United States Government”
These projections use Medicare and Social Security data from their respective trustees’ reports. Medicaid is assumed to grow at the same rate as Medicare. Discretionary spending from the war is phased out after 2010, with remaining discretionary spending assumed to expand at the same rate as GDP. The data do not account for any spending expected to be associated with the Emergency Economic Stabilization Act of 2008.
Endnotes
- In its “Mid-Session Review” in July 2008, the Office of Management and Budget projected a deficit of $482 billion for fiscal year 2009, which ends Sept. 30, 2009. Implementation of the Emergency Economic Stabilization Act is likely to add an additional several hundred billion dollars to the Treasury’s upcoming borrowing needs. [back to text]
- The change in national debt for 2008 includes $300 billion in the new Supplementary Financing Program Account. Through this program, the Treasury issues additional debt, depositing the proceeds into its account with the Federal Reserve. Because the Treasury records this as an increase in cash on-hand, it should more accurately be subtracted from the total change in debt. With this adjustment, the change in the national debt for 2008 would be just over $700 billion. [back to text]
- There are two Social Security trust funds, Old Age and Survivor Insurance (OASI) and Disability Insurance (DI). At the end of fiscal year 2008, they stood at $2.15 trillion and $216 billion, respectively. [back to text]
- Adjusting for the $300 billion described in endnote 2, the increase in the national debt for 2008 was 5.4 percent of GDP. [back to text]
- After adjusting for the $300 billion held in the Supplementary Financing Program Account, the total federal debt represented 68.2 percent of GDP, while debt held by the public amounted to 38.7 percent. [back to text]
- See Social Security Administration. [back to text]
- Treasury Department, 2007 Financial Report of the United States Government. [back to text]
- See Kotlikoff (2006 and 2008). [back to text]
- See Morrison and Labonte. [back to text]
References
Engen, Eric M.; and Hubbard, R. Glenn. “Federal Government Debt and Interest Rates,” in Mark Gertler and Kenneth Rogoff, eds., NBER Macroeconomics Annual 2004, pp. 83-160. Cambridge, Mass: MIT Press.
Gale, William G.; and Orszag, Peter R. “Budget Deficits, National Saving, and Interest Rates,” Brookings Papers on Economic Activity, 2004, No. 2, pp. 101-210.
Government Accountability Office, The Federal Government’s Financial Health: A Citizen’s Guide to the 2007 Financial Report of the United States Government, 2008. See www.gao.gov/financial/citizensguide2008.pdf.
Kotlikoff, Laurence J. “Is the United States Bankrupt?” Federal Reserve Bank of St. Louis Review, Vol. 88, No. 4, July/August 2006, pp. 235-49.
______. “Is the U.S. Going Broke?” Forbes, Sept. 29, 2008, pp. 34-35.
Morrison, Wayne M.; and Labonte, Marc. “China’s Holdings of U.S. Securities: Implications for the U.S. Economy,” Congressional Research Service, Order Code RL34314; May 19, 2008. See www.fas.org/sgp/crs/row/RL34314.pdf.
Office of Management and Budget. Mid-Session Review, Budget of the U.S. Government, Fiscal Year 2009, July 2008. See www.whitehouse.gov/omb/budget/fy2009/pdf/09msr.pdf.
Social Security Administration. The 2008 Annual Report of the Board of Trustees of the Federal Old-Age and Survivors Insurance and Federal Disability Insurance Trust Funds, March 2008. See www.ssa.gov/OACT/pubs.html.
Views expressed in Regional Economist are not necessarily those of the St. Louis Fed or Federal Reserve System.
For the latest insights from our economists and other St. Louis Fed experts, visit On the Economy and subscribe.
Email Us

