


Monetary Policy: The Whole Country Gets the Same Treatment, but Results Vary
Every six weeks or so, the Federal Open Market Committee (FOMC) meets to set the federal funds rate target, the Fed’s most commonly used monetary policy instrument. The federal funds rate is the overnight interest rate at which banks borrow from one another to cover shortfalls in reserves. Although the funds rate is a short-term rate, it is thought to affect longer rates such as mortgage rates and lines of credit used by firms to invest in plants and machinery. By adjusting the federal funds target and affecting these interest rates, the Fed tries to smooth the bumps in the economy.
For the most part, when analysts inside and outside the Fed consider the effects of changes in the federal funds rate, they look only at the aggregate national economy. But should the effects of changes in interest rates be considered regionally rather than nationally? Recent studies show that the impact of monetary policy varies across states. In other words, a single change in the federal funds rate affects individual states differently.
What causes the effect of monetary policy actions to vary across states? One possibility suggested and examined in a pair of studies by economists Gerald Carlino and Robert DeFina is that regional variation exists because states differ in their shares of interest-sensitive industries.
Which Industries Are Sensitive?
Some sectors of the economy, such as construction and manufacturing, are much more sensitive to changes in the interest rate than other sectors, such as services and retail. To understand why, ask yourself what you think of first when you hear that interest rates have fallen. Buying a house? A car? Why? Because the cost of the loan falls. The same is true for manufacturing firms. With lower interest rates, firms will initiate big projects (such as building or buying factories and equipment or purchasing land) that they had been considering; lower rates reduce the cost associated with undertaking projects and, thereby, increase overall investment in capital. This is not true for the retail and services sectors because these industries typically do not undertake the kind of long-term projects that are sensitive to interest rate changes. (However, interest rates can affect inventory decisions.) Although a change in policy does affect these less-sensitive sectors, the effect on these sectors tends to be slower and less pronounced than in construction and manufacturing.
Another reason sectors such as construction and manufacturing are more sensitive to interest rate changes is because the demand for their products depends more on consumers’ borrowing to buy them. The cost of a car loan or a house loan, for example, goes down when interest rates fall, causing an increase in the number of such loans. If more people are buying cars, automobile manufacturers will experience an increase in orders and production. On the other hand, interest rates do not dramatically alter the demand for services and for most products sold in the retail sector—for example, the cost of a shirt or a lamp is usually unaffected by a change in interest rates. The end result is that adjustments to interest rates have a relatively bigger impact in certain sectors.
Industry composition varies quite a bit from state to state. In 2000, for example, manufacturing accounted for approximately 28 percent of real gross state product (GSP) in Michigan, compared to about 7 percent in Wyoming. Overall, the state average for manufacturing share of GSP was about 18 percent for the 48 contiguous states. Each state’s contribution of retail and service firms also varies, as one might expect. Several states in the Southwest and Rocky Mountain regions had a higher contribution of retail and service to GSP in 2000 than the U.S. average, which was 28.7 percent.
Monetary Policy and the U.S.
Carlino and DeFina use real personal income to measure state-level and region-level economic activity and test the effect of a hypothetical change in monetary policy.1 Their goal was to determine to what extent real personal income reacts to contractionary monetary policy—in this case, an increase of one percentage point in the federal funds rate—with all other things being held equal.
On average, they find that, after a small initial rise, the level of real personal income declines substantially, reaching its maximum response approximately two years after an increase in the funds rate. For the most part, each of the 48 contiguous states follows this pattern. However, the magnitude of the decline in income and the speed of the adjustment varies across states. This indicates that the transmission of monetary policy may depend on individual state characteristics, especially industry composition.
For example, Michigan appears to be the state that is most sensitive to monetary policy. This makes sense, of course, because such a large percentage, relatively, of Michigan’s GSP is made up by manufacturing. Similarly, Wyoming’s response is smaller than the national average. Overall, Carlino and DeFina find that the contractionary monetary policy has the greatest effect on the Great Lakes region, a region that is dependent on the manufacturing sector of its economy. The regions that are least sensitive to an increase in interest rates are the Southwest and Rocky Mountain regions, which have a more diverse combination of industries. The other five regions respond more closely to the U.S. average.
The Eighth District States
The percent of GSP accounted for by manufacturing in the Eighth Federal Reserve District states in 2000 ranged from 17 percent in Illinois to 33 percent in Indiana.2 The District states’ average ratio of manufacturing to GSP was about 23 percent in 2000, slightly higher than the national average of 18 percent. It follows, then, that responses to monetary policy shifts in the Eighth District were more dramatic than the national average. Individually, the states that make up the Eighth District vary in their own right.3 The accompanying chart illustrates the effect of a hypothetical tightening of monetary policy across the states in the District. One can see that Illinois has a reaction almost identical to that of the United States, as does Kentucky. Arkansas, Mississippi, Missouri and Tennessee, however, are slightly more sensitive to monetary policy than the national average, while Indiana appears to react the most.
Conclusion
The effects of monetary policy in the United States are typically thought of only at the national level. Recent studies suggest, however, that some states, especially those for which manufacturing represents a large portion of the economy, are more sensitive to changes in interest rates than the country as a whole. Because there are large differences across states and regions in the relative importance of interest-sensitive industries, our understanding of the effects of monetary policy can be improved by considering state and regional data. For example, several economists have argued that the most recent recession was concentrated in the manufacturing sector. If so, it may be useful for monetary policy-makers to observe the response to changes in the fed funds target in states like Michigan and Indiana to get a better idea of whether or not monetary policy is having its desired effects.
Responses to Monetary Policy Shocks
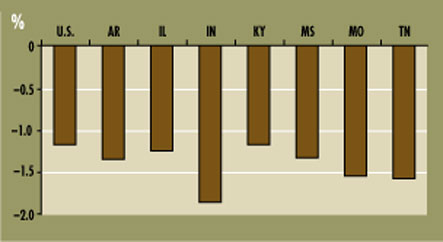
An increase of one percentage point in the federal funds rate affects real personal income in each of the District’s states differently over a two-year period. While Illinois and Kentucky react similarly to the United States, Arkansas, Mississippi, Missouri and Tennessee are slightly more sensitive than the national average. Indiana has the most dramatic reaction.
SOURCE: Carlino and DeFina (1999).
Endnotes
- Regions are defined by the Bureau of Economic Analysis (BEA). There are eight BEA regions: New England, Mideast, Great Lakes, Plains, Southeast, Southwest, Rocky Mountains and Far West. [back to text]
- The percent of manufacturing for the remaining District states in 2000 were: Arkansas, 23 percent; Kentucky, 26 percent; Mississippi, 21 percent; Missouri, 19 percent; and Tennessee, 22 percent. [back to text]
- Note that the Eighth District is made up of a portion of most of these states, not the entire state. [back to text]
References
Carlino, Gerald and DeFina, Robert. “The Differential Regional Effects of Monetary Policy: Evidence from the U.S. States,” Journal of Regional Science, May 1999, Vol. 39, No. 2, pp. 339-58.
_______ and _______. “The Differential Regional Effects of Monetary Policy,” The Review of Economics and Statistics, November 1998, Vol. 80, No. 4, pp. 572-87.

Views expressed in Regional Economist are not necessarily those of the St. Louis Fed or Federal Reserve System.
For the latest insights from our economists and other St. Louis Fed experts, visit On the Economy and subscribe.
Email Us