


A Brave New Economic World? The Productivity Puzzle
To hear many economists and policymakers tell it, U.S. economic performance is currently the best it has been in a generation—maybe even longer. Indeed, relatively low inflation, low unemployment and strong economic growth is a combination rarely seen over the past three decades or so. In fact, some analysts go so far as to insist that the U.S. economy has entered a new era. According to adherents of this view, businesses are finally harvesting the fruits from technological advancements related to the computer microchip, laser technology and fiber optic communications. Among the gains to the economy are better inventory management practices and improved productivity. Despite all the hoopla this economic performance has generated—much of it deserved—there are sound reasons to be concerned about future prospects for the U.S. economy. It all goes back to fundamentals.
Miserable No More?
My, how times have changed. A little more than five years ago, many economists were downright worried about the long-term prospects for increases in U.S. living standards.[1] Now, however, given the recent performance of several important economic indicators, many economists are wondering whether higher growth rates of real GDP and lower inflation rates are here to stay (see table). In fact, some believe that the current economic environment is reminiscent of the heady years (1950-70) in the aftermath of World War II, when the living standards of U.S. workers (real GDP per person) rose by almost 3.75 percent a year. This is more than double the nearly 1.5 percent a year gains seen from 1930 to 1950.[2]
The Best of Times?
How current economic statistics stack up against history
| Indicator | Performance/Level | Time Period | Best Performance Since |
|---|---|---|---|
| Inflation (CPI) | 2.2% | 1996:Q3 - 1997:Q3 | 1986:Q1 - 1987:Q1 |
| Unemployment Rate | 4.7% | 1997:Q4 | 1970:Q1 |
| Misery Index | 5.7% | 1997:Q3 | 1973:Q1 |
| Stock Market Returns (S&P 500) | 40.8% | 1996:Q3 - 1997:Q3 | 1982:Q3 - 1983:Q3 |
| New Home Sales | |||
| (millions of units at an annualized rate) | 824.0 | 1997:Q1 | 1978:Q4 |
| Consumer Confidence (1985=100) | 128.7 | 1997:Q4 | 1969:Q3 |
| Unified Budget Deficit ($billions) | $22.6 | Fiscal Year 1997 | Fiscal Year 1974 |
NOTE: Inflation and growth of the S&P 500 are four-quarter percent changes; measures of the unemployment rate, the misery index, new home sales and consumer confidence are quarterly averages of monthly rates.
Few comparisons between today's economic environment and that seen between 1950 and 1970 are as apt as the absence of debilitating rates of price inflation and high and rising unemployment rates. These were the twin maladies that plagued policymakers for much of the late 1960s to the early 1980s, when living standards reverted to their prewar rates of growth. After averaging 5.4 percent a year from 1980 to 1991, inflation during the current business expansion has been about half of that.
Low and stable inflation has been a boon for the economy, providing businesses with a solid foundation for undertaking investment initiatives, expanding production and boosting employment. In fact, in the fourth quarter of 1997, the civilian unemployment rate averaged 4.7 percent, its lowest level in more than 25 years. Moreover, real GDP has grown at an exceptionally strong 3.3 percent annual rate over the past two years, which is well above its 10-year average growth rate of 2.5 percent. With inflation and unemployment low, and real GDP growth high, the misery index in the third quarter of 1997 was at its lowest point in nearly 25 years.[3]
Does the recent macroeconomic performance of the economy signal the beginning of a new economic era—one whose operating paradigm is no longer rooted in the ebbs and flows of the traditional business cycle? Moreover, what is the role for monetary policymakers in this new paradigm? Can they now show less vigilance against inflation? At first glance, it would appear so, since the U.S. economy has experienced only three quarters of negative real GDP growth in the past 15 years, and the flames of inflation appear to have been extinguished for good—or at least sufficiently doused to be only marginally worrisome. But is there more to the story?
The conventional view—the one held by most forecasters—is that the recent surge in economic activity is typical of the increased production that normally accompanies the greater demand for goods and services seen over the course of the business cycle. Those who believe that something more fundamental is taking place, however, ask the following: With aggregate demand for goods and services exceptionally strong, why hasn't inflation accelerated as in previous expansions? Again, the conventional view holds that it eventually will once certain temporary factors that have been restraining inflation fade from view.[4]
There is, however, an alternative view, which has been looked upon favorably by Federal Reserve Chairman Alan Greenspan, among others.[5] At its core, this view holds that the considerable capital stock put into place by businesses over the past two to three years—augmented with impressive technological advancements related to the computer microchip—has boosted the economy's potential to grow over time. Strong growth and low inflation is simply the byproduct of this development.
For monetary policymakers, these two competing views offer an extraordinary challenge. The former view suggests that monetary policy, as in times past, has been perhaps too accommodating of this upsurge in demand. If this is true, then inflation will eventually accelerate, thus threatening the sustainability of the business expansion. The latter view, on the other hand, implies that the economy has entered a new economic era where inflation is permanently low and the capacity for growth is much higher than most thought possible. Why is the new paradigm story gaining sway with some very influential policymakers?
Know Your Fundamentals
Economists generally believe that economic growth can be measured by how fast living standards rise over time, which is usually defined as year-to-year increases in GDP per person (or per worker). A country's per capita GDP depends importantly on institutional factors that facilitate the production, distribution and sales of goods and services, otherwise known as the economy's "infrastructure."[6] Although many factors can come into play, a few crucial ones stand out—chief among them is the way a society organizes its form of government: Does the government encourage private ownership of the means of production and respect for the rule of law, including a willingness to stamp out corruption and enforce private contracts? Other crucial components of a healthy economic infrastructure are: an independent central bank that is committed to achieving price stability, an adherence to the principles of free trade, legal protection of copyrights and patents, and a regulatory system that effectively balances the costs and benefits of government intervention in the private sector. Economic infrastructure, then, appears to explain why per capita output in the United States is roughly seven times greater than that of Mexico, and nearly 10 times that of China.
If a country's economic infrastructure goes a long way toward explaining why U.S. citizens are much wealthier than those of Mexico or China—or every other country for that matter—it also directly influences those factors that determine how fast an economy grows over time. Two basic factors—labor intensity and labor productivity—determine this growth path over time, both of which can be affected by a wide variety of influences.[7] A country's labor intensity is determined by the number of people who are entering the labor force, and thus available to produce (and consume) goods and services. Labor intensity is mostly a function of population growth—which generally changes slowly—although immigration can have some effect.
It would be difficult to overstate the importance of labor productivity growth in determining future increases in living standards. Simply put, when economic resources (whether human beings, machines or land) are not very productive, the economy's potential to grow over time is severely constrained. To use a sports analogy, a running back who gains four yards per carry is much more productive than one who gains only two. Not surprisingly, the former is also paid much more than the latter. Thus, the more productive an economy's resources are, the more income they will produce, and the higher the nation's standard of living will be.
Labor productivity can be influenced by many factors. In general, though, it depends on a country's capital intensity, which comes in two forms—investment and human knowledge, or, what economists call, respectively, physical capital and human capital. The accumulation of physical capital (tangible investment) depends on such factors as a nation's saving rate, the return to investment and expectations of future economic growth. But capital intensity is also influenced by the accumulation of ideas, such as research and development (R&D) efforts that both build upon previous discoveries and lead to inventions that can be copyrighted or patented. The transfer of new ideas and technological advances in a free and open international trading environment is also crucial. The U.S. auto industry, for example, benefited immeasurably from the competition offered by Japanese-produced cars and trucks in the early 1980s.
The government can also play a positive role in spurring labor productivity. For instance, some economists favor permanent R&D tax credits and/or lower capital gains taxes to spur increased saving and investment. Government policy can play a key role in boosting human capital, too. Although it is very difficult to measure, human capital depends crucially on educational attainment, which is why many economists favor universal subsidies for higher education, or policies that would promote competition among private and public schools. Others believe that human capital can be boosted by "technological spillovers," which occur when workers are given specific knowledge and training that enables them to operate equipment and machinery which embodies the latest technology, thereby leading to increased real wages and higher living standards.
In the final analysis, an economy grows over time because of tangible factors—what economists call "real things." These real things influence a country's productivity growth and, ultimately, its standard of living.
What's Wrong with This Picture?
One way that a firm can offset increases in input costs is through greater labor productivity, namely by producing more goods and services at a lower cost per unit. All other things equal, this would tend to increase the firm's profits—thereby increasing the wealth of shareholders—and raise workers' real wages. If enough firms were able to accomplish this to affect the aggregate economy, the result would generally be rising output and falling rates of inflation—in other words, a pattern that is broadly consistent with the above-average economic growth and falling inflation rates seen in the United States for the past couple of years.
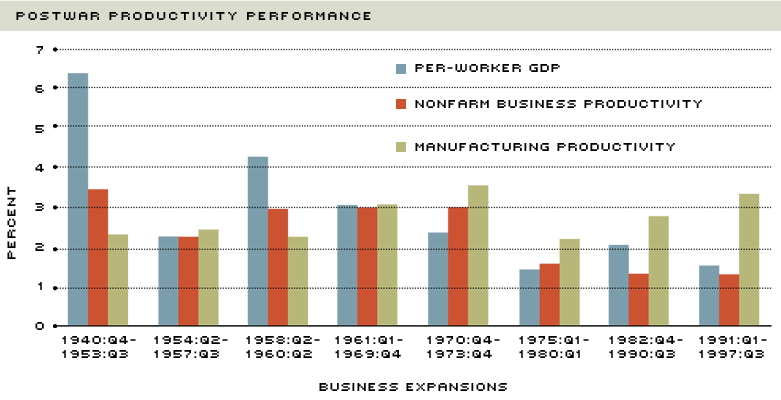
The peak of labor productivity growth and increases in living standards during the postwar era occurred prior to 1973. Specifically, productivity growth averaged nearly 3 percent during the five business expansions from late 1949 to late 1973. At this rate, U.S. living standards doubled about every 24 years. Does the current economy measure up to this impressive performance? Hardly. Labor productivity during the current expansion has risen by a paltry 1.3 percent average annual rate (see chart). In fact, this growth rate is virtually identical to that seen in the previous expansion. At this pace, it would take about 55 years for living standards to double.
Glimmers of a potential increase in the trend rate of labor productivity growth have recently emerged in the official statistics, however. For example, productivity grew at an impressive 2.7 percent rate through the first three quarters of 1997. But is it credible to assume that this growth is part of a dynamic that will return the U.S. economy to a time when labor productivity and living standards were roughly doubling every two generations? Economists do not yet have a good sense whether, as some have suggested, a fundamental shift has truly occurred, or, as others have claimed, that recent productivity gains are simply temporary developments associated with a strong, cyclical upsurge in U.S. output growth. Either way, it seems unwise to attach a great deal of importance to three quarters of—admittedly—exceptionally strong productivity growth. And, as Chairman Greenspan suggests, there may be two very important reasons why analysts should look beyond the productivity data as currently measured.
First, it is entirely possible that, despite their best efforts, government statistical agencies cannot adequately capture the rapidly changing makeup of the U.S. economy. The content of economic output, as Greenspan has noted, is becoming increasingly conceptual. That is, many firms—typically, service-oriented nonmanufacturing firms—create value by manipulating ideas or collecting and transmitting information. Measuring productivity improvements in these types of industries is difficult, to say the least. This problem is less acute in the manufacturing sector, though, where measuring physical quantities like cars and tons of steel is fairly straightforward. This is important because manufacturing productivity during this business cycle has increased by a little more than 3.25 percent a year, a gain that is surpassed only by that in the 1970-73 expansion. At the same time, though, productivity for the entire nonfarm business sector (manufacturing and nonmanufacturing) has grown by only about 1.5 percent this expansion. This large difference implies that nonmanufacturing productivity growth has been well below 1.5 percent.
Common sense would suggest that the manufacturing sector has seen its productivity improve considerably due to improved production processes brought about by technological gains. But if the manufacturing sector has been able to make better use of these advances, why hasn't the nonmanufacturing (services) sector been able to do the same? After all, both sectors have access to the same technology, and should therefore have equal opportunity to profit from these technologies. One reason why productivity gains may be underestimated in the nonmanufacturing sector is that it is very difficult to accurately measure the output of many services, which comprise roughly three-quarters of the U.S. economy. If output is mismeasured, then productivity is also mismeasured because productivity is simply output divided by inputs.
Many economists believe that current productivity data understate growth significantly because it is difficult to disentangle quality improvements captured within price changes. The technological advancements embedded within new automobiles or revolutionary medical procedures are good examples of this. This is important because a quality improvement should boost output (GDP), and thus productivity, while a price change should not. For example, if the CPI overstates the inflation rate by 1 percentage point a year, then, all other things equal, productivity growth would be biased downward by about 1 percentage point a year.8
Current productivity growth may be understated by that amount, or it may not. In short, it is anybody's guess as to how much current labor productivity growth is underestimated. Statistically speaking, though, an increasing share of output produced by the (hard-to-measure) nonmanufacturing sector may be biasing our estimates of economic growth and, as a result, the pace at which U.S. living standards are increasing. A recent Federal Reserve study provides some support for this view, concluding that the stagnant productivity growth measured in several service-oriented sectors is not consistent with the measures of profitability, output prices and wages in these sectors.9
The second reason why measured productivity gains may be elusive-despite the substantial amount of capital put in place by businesses in recent years-relates to the transition between technological eras. Stanford professor Paul David maintains that the productivity gains associated with the widespread use of electrical power that began in the late 1800s were very long in coming.10 David argues that significant productivity gains from the invention of the electric dynamo did not begin to emerge until the 1920s since old technologies, such as steam and water power, were not immediately discarded when electricity arrived on the scene. Moreover, new and innovative ways of using electricity in the manufacturing and production of goods also took time to develop.
The economy may currently be experiencing the same transition with the computer. As a share of GDP, investment in high-technology equipment is approaching 5 percent—a far cry from the approximately 1.75 percent from a decade earlier. It is just a matter of time, according to David and others, before firms learn how to fully adapt these technological advances to the production of goods and services.
Some Caveats
Measurement issues—which are admittedly important—aside, it is possible that the growth of worker productivity has slowed considerably over the past 25 years or so for more fundamental reasons. To begin with, the accumulation of physical capital over time largely depends on the saving behavior of a country's citizens. Simply put, the more a country saves, the more it invests. The more it invests, the more capital its workers have at their disposal and, in general, the more productive they will become. The end result is a higher standard of living. Perhaps one reason why recent productivity trends have been sorely disappointing is that the U.S. saving rate averaged just over 2 percent between 1983 and 1996, which pales in comparison to the more than 6 percent saving rate seen between 1946 and 1982.
Because ideas are important in promoting the technological process, R&D efforts can play a critical role in determining long-term increases in living standards. Another possible reason, then, why current productivity growth does not measure up to previous periods is that there has been a significant drop in the amount of resources devoted to R&D. Spending on R&D fell from just under 3 percent of GDP in the early 1960s to about 2 percent in the late 1970s. Although it recovered strongly, rising to nearly 2.75 percent by 1985, it has started to wane once again, averaging about 2.5 percent of GDP in 1996.
Human capital is a key component of the production process—especially in a knowledge-based economy. Therefore, a final reason why worker productivity growth has slowed could be the performance of our education system, particularly at the elementary and secondary levels. According to a recent survey, U.S. students registered the lowest average test score from the Third International Mathematics and Science Study.11
And the Verdict Is...
As nearly all economists recognize, measuring productivity accurately is a difficult task. Still, a cursory look at economic fundamentals suggests there are reasons to believe that things are not as rosy as many insist. At the same time, there are also solid reasons to believe that technological improvements related to the computer microchip have changed the U.S. economy in fundamentally important ways—improved labor productivity growth and slowing rates of inflation, among them. Although signs of faster productivity growth have begun to emerge in the official statistics, it is too early to determine whether these gains are permanent, or, as others have claimed, simply temporary. Thus, while greater gains in labor productivity would be a welcome development for monetary policymakers, it remains true that inflation is ultimately determined by how fast the central bank creates money. By itself, therefore, faster productivity growth—if that is what is occurring—is not enough to keep inflation low and stable.
Endnotes
- See Federal Reserve Bank of Kansas City (1992). [back to text]
- See Mankiw (1997). [back to text]
- The misery index is the sum of: the unemployment rate, the inflation rate, and the quarterly change in the long-term Treasury interest rate, less the deviation of quarterly real GDP growth from its 10-year average. [back to text]
- The most commonly cited factor in this regard is the recent effort of businesses to rein in benefit costs (and in particular, health care costs). [back to text]
- See Greenspan (1997). [back to text]
- See Hall and Jones (1997). The term infrastructure, as used here, does not refer to a nation's roads, bridges, highways, tunnels or other structures. [back to text]
- Broadly speaking, growth of per capita GDP (living standards) is the sum of output per hour (labor productivity) and the number of hours worked per capita (labor intensity). By this formula, the U.S. economy's potential growth rate appears to be between 2 percent and 2.5 percent, with labor intensity contributing about 1 percent of this growth and labor productivity contributing roughly 1 percent to 1.5 percent. A good discussion of this topic can be found in the Minneapolis Fed's 1996 Annual Report. [back to text]
- See Kliesen (1996). [back to text]
- See Slifman and Corrado (1996). [back to text]
- See David (1990). [back to text]
- U.S. students were compared with those from the other Group of Seven (G-7) countries: Canada, France, Germany, Italy, Japan and the United Kingdom [back to text] .
References
David, Paul A. "The Dynamo and the Computer: An Historical Perspective on the Modern Productivity Paradox," The American Economic Review (May 1990), pp. 355-61.
Greenspan, Alan. "Remarks at the University of Connecticut," Storrs, Conn., October 14, 1997.
Federal Reserve Bank of Kansas City. Policies For Long-Run Economic Growth, A Symposium Sponsored by the Federal Reserve Bank of Kansas City (1992).
Federal Reserve Bank of Minneapolis. Breaking Down the Barriers to Technological Progress: How U.S. Policy Can Promote Higher Growth, 1996 Annual Report.
Hall, Robert E. and Charles I. Jones. "Levels of Economic Activity Across Countries," The American Economic Review (May 1997), pp. 173-77.
Kliesen, Kevin L. "Critiquing the Consumer Price Index," The Regional Economist, Federal Reserve Bank of St. Louis (July 1997), pp. 10-11.
Mankiw, N. Gregory. Principles of Economics (Fort Worth, Tex.: The Dryden Press, 1997).
Slifman, Larry and Carol Corrado. "Decomposition of Productivity and Unit Costs," Mimeo, Board of Governors of the Federal Reserve System (November 18, 1996).

Views expressed in Regional Economist are not necessarily those of the St. Louis Fed or Federal Reserve System.
For the latest insights from our economists and other St. Louis Fed experts, visit On the Economy and subscribe.
Email Us