


What Is Driving Unauthorized Immigration to the U.S.?
KEY TAKEAWAYS
- The pool of unauthorized immigrants in the U.S. rose in the 1990s through 2007, but it has since remained steady as outflows offset inflows.
- In early 2017, the number of unauthorized immigrants crossing the U.S. border dropped sharply but began rising steadily once again.
- A recent spike in attempts to cross the southwestern border may be driven by violence and civil strife in Central American nations.
Unauthorized immigration has been an issue of central concern to U.S. policymakers, as well as the country’s general population. There are two prominent dimensions around which this issue is discussed: First, what is the size of the unauthorized immigrant pool in the existing U.S. population? Second, how is this pool growing or shrinking over time? The nature of unauthorized immigration makes exact accounting of these numbers difficult.
However, the first question can be addressed by Department of Homeland Security estimates of people in the unauthorized immigration pool. To answer the second question, we assumed, along the lines of the existing literature, that if a greater number of immigrant border encounters are reported by U.S. Customs and Border Protection, this suggests a larger number of attempts to cross the border. In turn, one can expect that a larger number of unauthorized immigrants will cross the border successfully.
In this article, we first discuss some factors that drive unauthorized immigration. Next, we focus on the magnitude of the unauthorized immigration pool in the U.S. and identify the major source nations contributing to this pool. Finally, we see how immigrant border encounters have evolved in recent months and discuss some characteristics of these potentially unauthorized immigrants.
Drivers of Unauthorized Immigration
While legal immigration is subject to policy limits, there is no direct and acceptable way to restrict unauthorized immigration to some predetermined level. The federal government tries to restrict the inflow of unauthorized immigrants by using border control measures enforced by border patrol agents.
However, as long as “push” factors (such as poverty or violence in source nations) and “pull” factors (like good job opportunities in the U.S.) are strong enough, some potential immigrants will try to cross the border in spite of potential costs that may include payments to smugglers or detention. In the 1990s and until the Great Recession of 2007-09, the economic incentive of relatively good job opportunities in the U.S. drove most of this unauthorized immigration. However, in recent years, push factors such as violence and political instability in source nations have become more prominent drivers.
The U.S. Unauthorized Immigrant Pool and Major Source Nations
The total pool of unauthorized immigrants in the U.S. rose sharply through the 1990s and kept rising through 2007. However, from 2007 onward, the estimated pool has been steady at around 11.5 million to 12 million people. This has happened despite a relatively steady decline in the unauthorized pool of Mexican nationals because of a compensating rise in the unauthorized pool from other source nations.
The first figure below presents the evolution of the unauthorized immigrant pools of the top six source nations, of which Mexico is the largest.Data for unauthorized immigrant pools based on national origin are available on a continuous basis from 2005 to 2018. The “Other” category in the first figure represents the unauthorized immigrant pool from all countries other than the top six source nations identified. Immigration from Mexico began falling during the Great Recession (shaded in gray) and has been falling steadily since then. All the other top source nations in the graph exhibit increases in their respective unauthorized immigrant pools in recent years.
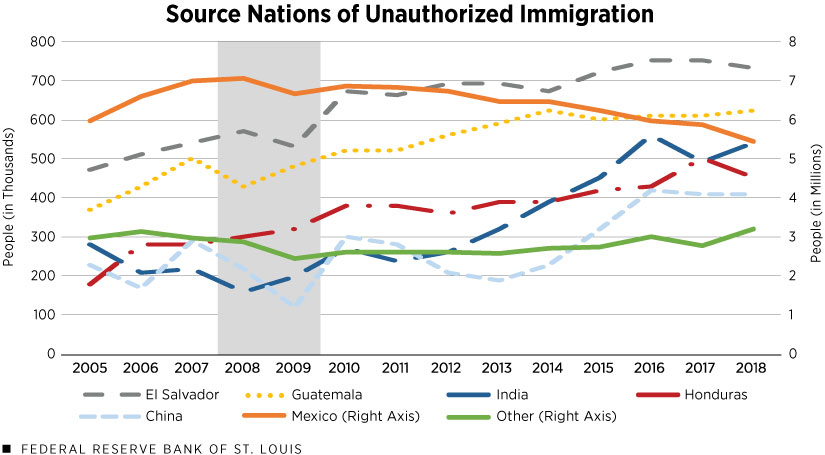
SOURCES: Department of Homeland Security Office of Immigration Statistics and authors’ calculations.
The relatively large numbers for far-away nations like China and India may be because of the population sizes of these nations and the fact that immigrant pools reflect not only unauthorized border entrants but also people who may have overstayed their visas. The large numbers from Central American nations such as El Salvador, Honduras and Guatemala reflect, among other factors, push factors such as violence and civil strife.
Border Enforcement Encounters in Recent Times
Next, we focused on border enforcement encounters in recent times to get a sense of the recent unauthorized immigration inflow to the U.S. We present the data for the southwestern U.S. border because that is where most unauthorized border crossings occur.Enforcement encounters are composed of U.S. Title 8 apprehensions and U.S. Title 42 expulsions. Title 8 apprehensions are processed under U.S. Customs and Border Protection’s immigration authority; they refer to the physical control or temporary detainment of a person who is not lawfully in the U.S., which may or may not result in an arrest. Title 42 was invoked as a public health-related response to COVID-19 during March 2020. The starting point of January 2015 precedes by two years the beginning of the Trump administration, which had signaled its intention to reduce border crossings, and provides a useful benchmark to see whether the 2016 election led to discernible changes.
Indeed, there was a sharp dip in early 2017, followed, however, by a steady increase. (See the second figure below.) There was a spike in enforcement encounters around the middle of 2019, driven mostly by “Family Units” enforcement encounters.Family Units represent the number of individuals (either a child younger than age 18, a parent or legal guardian) encountered in a family unit. “Other” is the difference between total enforcement encounters and the sum of the "Unaccompanied Alien Children" and Family Units categories. This difference has been identified as “Single Adults” since fiscal year 2019, in the data provided by U.S. Customs and Border Protection. Although precise identification is beyond the scope of this piece, the spike in Family Unit encounters suggests push factors were driving entire families from violence-prone source nations to the perceived safety of a more stable host nation.As we discuss later, the third figure points to similar strife-driven push factors.
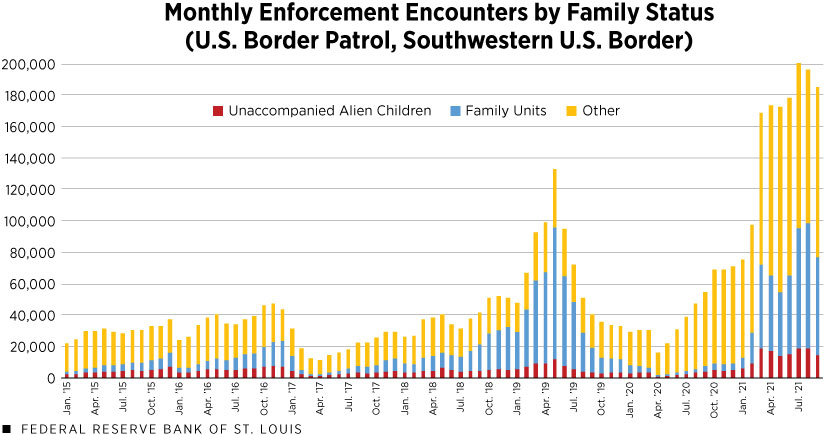
SOURCES: U.S. Customs and Border Protection, and authors’ calculations.
NOTE: This information was accessed on Nov. 4, 2021.
COVID-19 and its associated governmental measures led to a sharp decline in enforcement encounters by the middle of 2020 and an almost complete elimination of encounters in the Family Units or “Unaccompanied Alien Children” categories. However, in recent months, there has been a surge driven most prominently by large numbers in the Family Units category.
We based the third figure below on enforcement encounters data, which identify some source nations of the apprehended. (These monthly data were available starting in fiscal year 2018.) While overall enforcement encounters in recent months have increased, the increases are particularly strong for the three Central American nations shown in the figure. While the data are available for too short a period to draw any definitive conclusions, they suggest that push factors have driven families and children from many Central American nations to try to immigrate to the U.S.
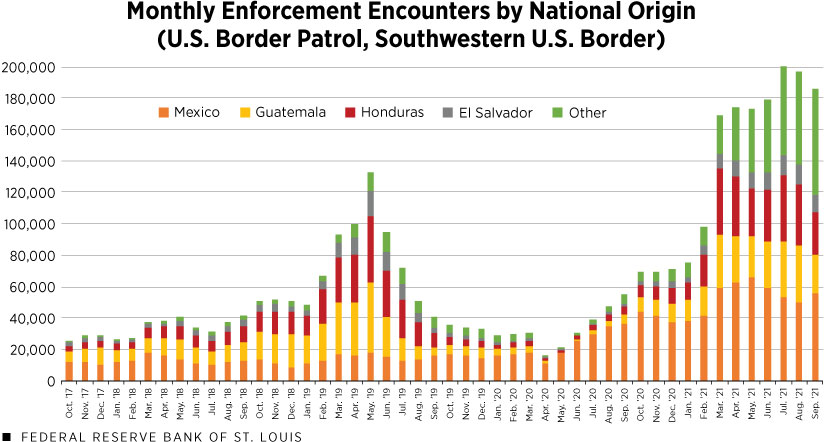
SOURCES: U.S. Customs and Border Protection, and authors’ calculations.
NOTE: This information was accessed on Nov. 4, 2021.
Conclusion
Unauthorized immigration remains a major policy issue for the U.S. The evidence points to the primacy of push factors in driving the recent surge. More research is necessary to shed light on the contributions of different push factors such as poverty, violence or political instability that may be contributing to this increase in unauthorized immigration.
While greater enforcement at the border can dampen immigration flows, a durable solution lies in identifying the central push factors and how they can be best addressed by the U.S. in coordination with the source nations of the immigrants.
Endnotes
- Data for unauthorized immigrant pools based on national origin are available on a continuous basis from 2005 to 2018. The “Other” category in the first figure represents the unauthorized immigrant pool from all countries other than the top six source nations identified.
- Enforcement encounters are composed of U.S. Title 8 apprehensions and U.S. Title 42 expulsions. Title 8 apprehensions are processed under U.S. Customs and Border Protection’s immigration authority; they refer to the physical control or temporary detainment of a person who is not lawfully in the U.S., which may or may not result in an arrest. Title 42 was invoked as a public health-related response to COVID-19 during March 2020.
- Family Units represent the number of individuals (either a child younger than age 18, a parent or legal guardian) encountered in a family unit. “Other” is the difference between total enforcement encounters and the sum of the "Unaccompanied Alien Children" and Family Units categories. This difference has been identified as “Single Adults” since fiscal year 2019, in the data provided by U.S. Customs and Border Protection.
- As we discuss later, the third figure points to similar strife-driven push factors.


Views expressed in Regional Economist are not necessarily those of the St. Louis Fed or Federal Reserve System.
For the latest insights from our economists and other St. Louis Fed experts, visit On the Economy and subscribe.
Email Us