


Understanding the Roots of the U.S. Trade Deficit
KEY TAKEAWAYS
- Profound economic changes lie at the root of both the U.S. trade deficit and declining manufacturing employment.
- The role of the U.S. dollar as an international reserve currency has helped finance domestic consumption of imported goods.
- Labor productivity and a shifting of comparative advantage to developing nations explain the loss in manufacturing jobs.
Introduction
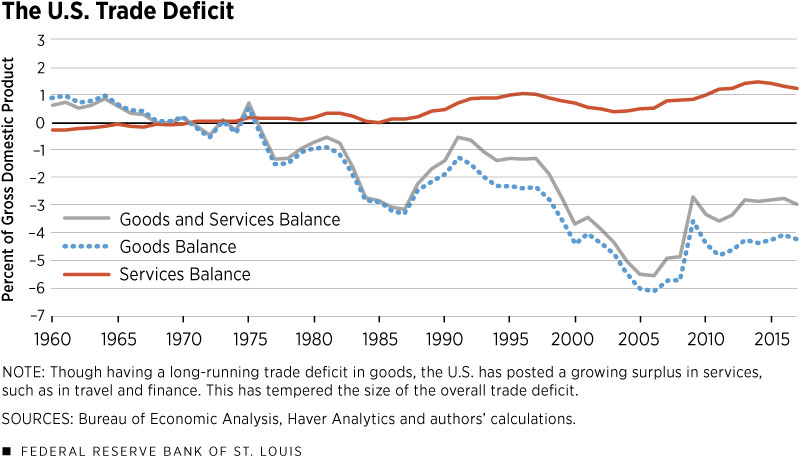
Running a trade deficit is nothing new for the United States. It has been running trade deficits since the 1970s. (See Figure 1.) However, trade deficits have recently become hotly scrutinized.
Figure 1
Since World War II, the U.S. has promoted free trade and globalization; its commitment was best exemplified by its push to create the World Trade Organization (WTO) and to negotiate the North American Free Trade Agreement (NAFTA). But America’s enthusiasm for free trade has recently waned: It pulled out of the Trans-Pacific Partnership (TPP), called for a renegotiation of NAFTA, and imposed trade tariffs on China and other nations.
Much of the concern over trade deficits stems from a fear that these deficits lead to declining manufacturing employment. In this article, we will explore why the U.S. runs a trade deficit, why manufacturing employment is declining, and how these two are related. Then we will look specifically at the case of China.
The Collapse of the Bretton Woods System
After World War II, a new international monetary system called Bretton Woods was created that would draw lessons from the previous gold standards abandoned after World War I and the experiences of the Great Depression. Bretton Woods established (1) the U.S. dollar was to be an international reserve currency, (2) the U.S. dollar would be backed by gold at a price of $35 per ounce, and (3) any country could exchange dollars for gold. This new system facilitated and stabilized global trade, especially trade among the industrialized nations.
However, after years of expansionary growth in U.S. aggregate demand in the 1960s, countries running trade surpluses with the U.S. sought to exchange their dollars for gold, which rapidly shrunk U.S. gold reserves. The U.S. then ran the risk of failing to meet its obligation to redeem dollars for gold at the official price. Thus, President Richard Nixon effectively ended the Bretton Woods system in 1971.See Ghizoni.
The U.S. decision to end dollar convertibility to gold and the subsequent collapse of the Bretton Woods system in the early 1970s meant that the world economy entered a new era: The U.S. dollar became the global currency, and U.S. government securities became the most-demanded foreign reserve in the world. This outcome resulted from the historical strength of the U.S. currency. Consequently, the dollar became as good as gold (despite the fact that it is a fiat currency), which fuels demand for U.S. currency and securities to be used both as an international medium of exchange and store of value.
When the U.S. can purchase goods from the world market simply by printing money or issuing debt, it is destined to run persistent trade deficits. Indeed, just a few years after the end of the Bretton Woods system, the U.S. trade balance started to show persistent and growing deficits, which continue today. (See Figure 1.)
Foreign holdings of U.S. Treasury securities also started to increase in the early 1970s immediately following the end of the Bretton Woods system. More than 40 years later, by 2014, foreign holdings of U.S. Treasury securities reached more than $6 trillion. Similarly, we see the rising share of foreign holding of U.S. debt from as low as 3 percent in 1970 to as high as 34 percent in 2015. Also, foreign holdings of U.S. dollar reserves have reached $6 trillion, making the total amount of foreign holdings of U.S.-issued IOUs around $12 trillion.
Simple Accounting Helps Explain the Trade Deficit
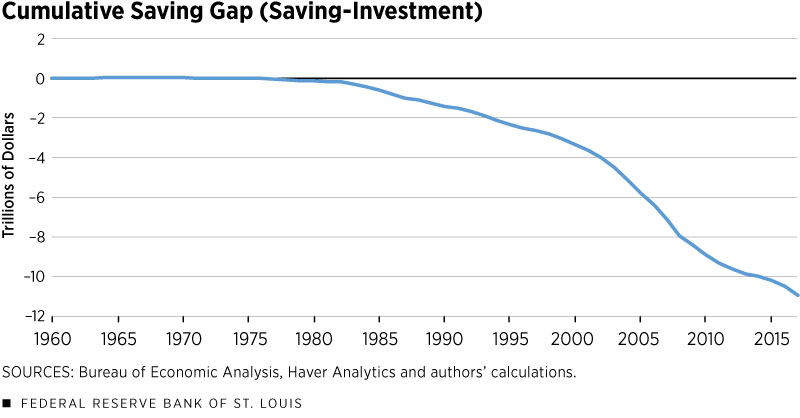
In macroeconomic theory, net exports—the country’s trade balance—equal national savings minus investment; i.e., NX = S – I.This idea follows from the national account identity that gross domestic product (GDP) is the sum of consumption, investment, government spending and net exports (Y = C + I + G + NX). Gross savings are defined as GDP minus consumption and government spending (S = Y – C – G). Then by rearranging the national accounting identity with the definition of gross savings, we obtain the relationship that net exports is equal to national savings minus investment (NX = S – I). Therefore, a nation runs a trade deficit when savings are less than investment (S < I) and runs a trade surplus when savings are greater than investment (S > I). Thus, imbalanced trade implies insufficient national savings (private savings plus government savings) to finance national investment. Hence, as saving and investment became mismatched, the saving gap (S – I) started to grow more and more negative around the early 1970s, suggesting rapidly accumulating private debt and public debt in the U.S. Figure 2 shows that the cumulative saving-investment gap started to grow in the middle 1970s and ballooned to $11 trillion in recent years, suggesting roughly an equal amount of foreign holdings of U.S. currency and government bonds.
Figure 2
Therefore, the current international monetary system—based on the U.S. dollar as the dominant world reserve currency and U.S. government securities as the most-sought-after store of value—is the root cause of persistent trade deficits in the U.S.
Had the Bretton Woods system been kept in place, the U.S. ability to issue an astronomical amount of U.S. dollars and Treasuries as a substitute for gold in the global market would have been severely constrained, and U.S. trade would have been far more balanced.
Deficits and Manufacturing
Do trade deficits lead to declining manufacturing? Not necessarily. Of course, if a nation relies heavily on imported manufactured goods and exports only raw materials, then persistent trade deficits may lead to declining employment in manufacturing. This often occurs in developing countries with low productivity growth in manufacturing.
The more likely causes of declining U.S. manufacturing employment are rapid technology growth and improved labor productivity. This is similar to what happened in the U.S. agricultural sector—agricultural employment used to absorb 80 percent of the labor force in the 19th century, but it now requires less than 2 percent of the labor force, thanks to rapid improvement in the productivity of agricultural production.
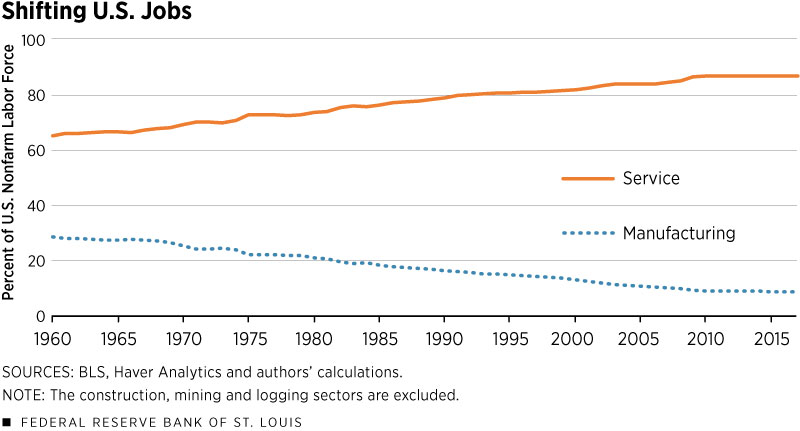
Therefore, the declining manufacturing employment in the U.S. may have little to do with U.S. trade deficits. In fact, data show the downward trend of manufacturing employment in the U.S. started in the 1960s (see Figure 3) as labor productivity continuously rose in the manufacturing sector; it has increased sevenfold in the U.S. since 1960.
Figure 3
Indeed, using a calibrated dynamic stochastic general equilibrium model, economists Timothy Kehoe, Kim Ruhl and Joseph Steinberg showed that 85 percent of the employment reduction in the goods manufacturing sector from 1992 to 2012 was due to the rapidly rising labor productivity in that sector, and only the remaining 15 percent was due to rising U.S. trade deficits with the rest of the world.See Kehoe et al.
When workers get pushed out of agriculture and goods-producing sectors, they enter the service sector. This phenomenon of structural change (caused by technology growth) is observed across all successfully industrialized nations.
Accompanying this structural change is the phenomenon of outsourcing: Firms with obsolete or older technologies at home that hire domestic workers at low wages will either go out of business or find it profitable to move to developing countries.
The Shifting of Comparative Advantage
Labor-intensive mass production technology used to be profitable in the U.S., but technological improvements and rising labor productivity (and hence real wages) induce firms to adopt capital-intensive production technologies to save on labor costs.
However, instead of going out of business, firms with labor-intensive technologies can move abroad where labor is still cheap, such as China and India. Behind this trend of firm migration from advanced nations to developing nations is the shifting of comparative advantage.
Historically, industrialization has three phases: (1) the first industrial revolution features labor-intensive mass production, (2) the second industrial revolution features capital-intensive mass production, and (3) the welfare revolution features a service-oriented welfare state.See Wen.
The first phase of industrialization results in labor shifting away from agriculture to labor-intensive goods production such as textiles. As labor costs rise, a nation then enters the second phase because rising labor costs make labor-intensive production unprofitable; its original comparative advantage now shifts toward labor-saving technology or capital-intensive technology. This shift causes labor-intensive firms or labor-intensive technologies to move abroad.
As labor costs further increase and capital becomes even cheaper—thanks to continuously improving technologies and rising labor productivity—a nation experiences deindustrialization and enters a service-oriented welfare state with new jobs and technologies, such as vibrant health and financial industries that employ advanced information technologies.
In this stage, as the service sector becomes the dominant sector, and the agriculture and manufacturing sectors shrink due to their high labor productivity, nations can afford to run big welfare programs, such as unemployment insurance, social security and free medical care. The manufacturing sector also starts to be reallocated to other nations with comparative advantages in labor and land costs.
Thus, as the U.K., for example, finished its first industrial revolution (labor-intensive mass production) and entered the second industrial revolution (capital-intensive mass production) in the middle 19th century, the rest of Europe and the U.S. became the main adopters of labor-intensive technology and the main exporters of labor-intensive goods.
After the U.S. entered its own second industrial revolution in the late 19th and early 20th centuries, nations such as Japan were the main adopters of labor-intensive technology and became the main exporters of labor-intensive goods in the early 20th century. Meanwhile, the U.K. entered the welfare state, while the U.S. became the powerhouse of capital-intensive manufacturing before WWII.
After WWII, especially in the 1960s, the U.S. started to enter the welfare state, while its manufacturing sector began to be reallocated abroad. In the 1980s, when Japan entered the welfare state, the so-called Asian Tigers became the main producers and exporters of labor-intensive goods. By the 1990s, when the Asian Tigers adopted capital-intensive technology due to rising labor costs, China became the main producer and exporter of labor-intensive goods.
Today, China is at the cusp of entering the capital-intensive production stage as its labor costs rapidly rise. So we see labor-intensive production firms reallocating away from China and moving into other Asian countries (such as Vietnam and India) and Africa.
Is China to Blame?
Manufacturing employment in the U.S. declined nearly 20 percent from 2000 to 2007, even before the Great Recession. This sharp decline correlates with a worsening U.S. trade balance and a growing trade deficit with China. Based on this coincidental evidence, it is easy to point the finger at China. But is China to blame for the declining U.S. manufacturing jobs?
China entered the world stage as a manufacturing powerhouse in the past decades, thanks to the global shifting of comparative advantage. As mentioned earlier, since WWII, the global comparative advantage in manufacturing shifted from the U.S. to the postwar recovering countries such as Germany and Japan. It then gradually shifted to the emerging Asian Tigers in the 1970s and 1980s, and then to China after that. Indeed, of the total U.S. goods trade deficit, the East Asian and Pacific region (including China) alone accounted for more than 80 percent in 1991.
However, although the total U.S. goods trade deficit with Asia (including China) has been increasing, the Asian share (including China) of the U.S. goods trade deficit as a whole has been steadily declining since 1991, now standing at around 65 percent, despite China’s rise as the largest supplier of goods to the U.S.—and by extension, the biggest creditor to the U.S.
In other words, the rise of China since the late 1980s—especially after joining the WTO in 2001—has not increased the total share of Asia’s contribution to the U.S. trade imbalance; China simply substituted out other Asian economies by taking their positions. That is, even though China’s share in total U.S. trade deficits has been increasing rapidly from around 15 percent in 1991 to 45 percent around 2016, it has not increased the total share of Asia’s trade position with the U.S.
Conclusion
The long-running U.S. trade deficits and the emergence of China as a major creditor nation to the U.S. seem to be the result of two major economic forces: (1) the breakdown of the Bretton Woods system, which caused the U.S. currency and U.S. government debts to become the world currency and a global form of liquidity and store of value; and (2) the shifting of comparative advantage in goods production, which caused the reallocation of labor-intensive manufacturing from the U.S. to nations with cheaper labor.
Given this perspective, a trade war with China may not necessarily solve the U.S. trade imbalance problem. There are three likely outcomes from an extended trade conflict with China: (1) Chinese imports will become more expensive; (2) U.S. trade deficits will shift to other countries with similar comparative advantages in producing labor-intensive goods; and (3) U.S. exports to China will become more expensive as a result of China’s retaliation. None of the above is likely to increase U.S. exports and reduce its trade deficits.
Most important, a trade war with China cannot stop declining American manufacturing employment if it is driven mainly by rapid technology progress, such as automation, robots and artificial intelligence. Instead, it may significantly reduce American consumers’ welfare and cause the U.S. to lose its leadership in free trade and globalization.
The U.S. has a long, successful history of promoting public education that has allowed workers to remain skilled and adaptable to a changing world. Therefore, the U.S. may need to more effectively promote education and job training programs that will allow Americans to better compete in a rapidly changing global environment. This policy will not necessarily increase manufacturing employment per se but would train workers for highly skilled manufacturing and services, which are the future of the economy.
Endnotes
- See Ghizoni.
- This idea follows from the national account identity that gross domestic product (GDP) is the sum of consumption, investment, government spending and net exports (Y = C + I + G + NX). Gross savings are defined as GDP minus consumption and government spending (S = Y – C – G). Then by rearranging the national accounting identity with the definition of gross savings, we obtain the relationship that net exports are equal to national savings minus investment (NX = S – I). Therefore, a nation runs a trade deficit when savings are less than investment (S < I) and runs a trade surplus when savings are greater than investment (S > I).
- See Kehoe et al.
- See Wen.
References
Ghizoni, Sandra Kollen. Creation of the Bretton Woods System. Federal Reserve History website, Nov. 22, 2013.
Kehoe, Timothy J.; Ruhl, Kim J.; Steinberg Joseph B. Global Imbalances and Structural Change in the United States. Journal of Political Economy, April 2018, Vol. 126, No. 2.
Wen, Yi. The Making of an Economic Superpower—Unlocking China’s Secret of Rapid Industrialization. Working Paper 2015-006B, Federal Reserve Bank of St. Louis, June 2015.


Views expressed in Regional Economist are not necessarily those of the St. Louis Fed or Federal Reserve System.
For the latest insights from our economists and other St. Louis Fed experts, visit On the Economy and subscribe.
Email Us