


Unauthorized Immigration in the U.S.: Trends in Recent Years
KEY TAKEAWAYS
- The number of unauthorized immigrants in the U.S. grew rapidly from 1990 to the Great Recession. Since then, this population has leveled off.
- Mexico remains the biggest source nation of unauthorized immigrants, but the net inflows from that country have often been negative since the Great Recession.
- Changes in Mexican immigration may be due to reduced economic opportunities in the U.S. relative to those in Mexico or increased enforcement of U.S. immigration laws.

Immigrants contribute to the U.S. economy through their labor, skills and entrepreneurial capital. And immigration has long been considered a key part of the American experience. However, large inflows of immigrants can increase competition for jobs, thereby driving down wages for workers already residing in the country.
Keeping economic as well as social concerns in mind, lawmakers enact legislation that establishes the appropriate level of legal immigration and the process for foreigners to lawfully enter the U.S. Any person entering the U.S. or living in the country in violation of these laws is an “unauthorized immigrant.”
The Pew Research Center estimates that there were 10.7 million unauthorized immigrants in the U.S. in the year 2016 (according to preliminary estimates). To put this number in perspective, the total foreign-born population, as measured using census data, was about 43.7 million in 2016.“Foreign-born” is defined by the Census Bureau as anyone who is not a U.S. citizen at birth. Details are available at www.census.gov/topics/population/foreign-born.html. Given its substantial share of the foreign-born population and its centrality in the current policy debate, we focus this article on the evolution of unauthorized immigration in recent years. In particular, we first discuss how the population of unauthorized immigrants evolved from 1990 until 2014 (the latest year in our data sources) and how this evolution is related to unauthorized immigration from Mexico. (Data availability limits the time periods over which we look into the following issues.)
We then outline the leading source nations of unauthorized immigrants and see how the immigrant flows evolved from 2005 to 2014, the latest year when these data are available. Next, we look at the state of residence of the unauthorized immigrants in the U.S. for the years 1990 and 2014, and compare changes between these years. Finally, we discuss the evolution of U.S. enforcement, as evidenced by the deportation of unauthorized immigrants between 1990 and 2016.
The Unauthorized Immigrant Population
Figure 1 traces the total population of unauthorized immigrants in the U.S. over the period 1990-2014. In 1990, the total unauthorized immigrant population in the U.S. was 3.5 million. This population grew through the 1990s, averaging an annual rise of around 330,000; by 1999, the total population reached 6.5 million. It increased further between 2000 and 2007. The expansion of the U.S. economy in the years leading to the Great Recession was likely an important factor responsible for this.
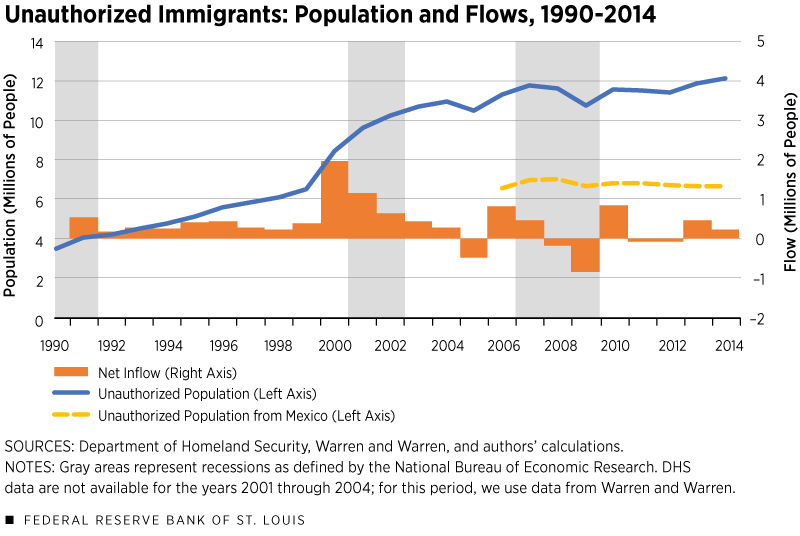
There was a significant dip in the unauthorized immigrant population at the time of the Great Recession (December 2007-June 2009). The lack of employment opportunities, among other factors, likely played a role in bringing this population down by around a million people between 2007 and 2009 (11.8 million and 10.8 million, respectively). Coinciding with the economic recovery, immigration rebounded, with the number of unauthorized immigrants at 12.1 million in 2014. According to recent estimates by the Pew Center, the population in 2015 was around 11 million and around 10.7 million in 2016. The overall picture is one of a sharp rise in unauthorized immigration at the turn of the century, followed by modest growth until 2007 and then a leveling off.
Unauthorized Immigration from Mexico
The dashed yellow line in Figure 1 traces the unauthorized immigrant population from Mexico. In 2005, Mexican nationals represented around 57 percent of the total unauthorized immigrant pool, making that country by far the largest source nation of unauthorized immigrants.
Unauthorized immigration from Mexico peaked in 2008 at 7.0 million (60.6 percent of the total) and then modestly declined to 6.6 million (54.8 percent of the total) in 2014. The initial drop was probably associated with the Great Recession, but we have not seen increases in recent years due to a combination of factors, including demographic changes in the Mexican economy (such as the slowdown of population growth and decline in fertility rates).See Passel et al., and Massey.
Compared with the early 2000s, there has also been more enforcement effort. For example, the budget for the U.S. Customs and Border Protection (CBP) increased from $6.3 billion in 2005 to $11.7 billion in 2012 (in absolute dollars),In 2012 dollars, CBP’s budget increased from $7.4 billion to $11.7 billion. according to a report by the Migration Policy Institute. Further, the size of the Border Patrol has doubled since 2004, increasing from 10,819 agents in 2004 to 21,370 in 2012.See Meissner et al.
Other Major Source Nations
Figure 2 presents the population of unauthorized immigrants from other major source nations: El Salvador, Guatemala, India, Honduras and the Philippines. Although modest in comparison to the numbers from Mexico, the level of unauthorized immigrants from El Salvador steadily increased from around 470,000 in 2005 to around 700,000 in 2014. Similar patterns are seen for Guatemala, India, Honduras and the Philippines. These increases for source nations other than Mexico (which actually showed a decline in 2014) contributed to total unauthorized immigration peaking at 12.1 million in 2014. However, the overall contribution of any of these nations is not large, with El Salvador—the largest source among these nations—contributing only 5.8 percent of the total unauthorized immigrant population in 2014.
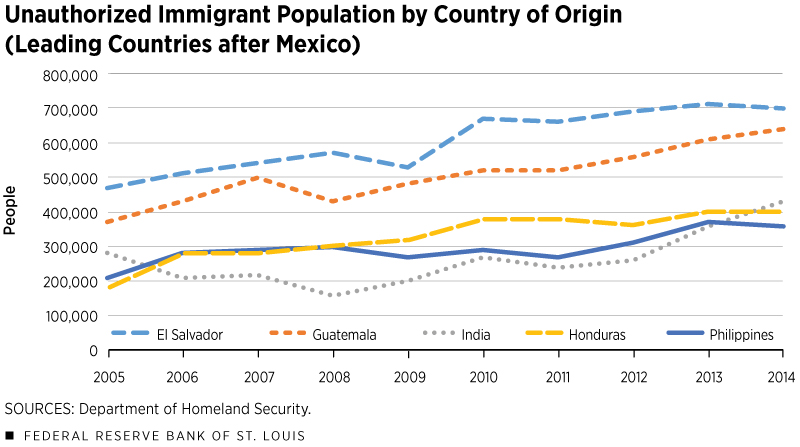
Increasing violence in these source nationsSee www.pewhispanic.org/2013/09/25/2011-national-survey-of-latinos/; and www.pewhispanic.org/2017/12/07/rise-in-u-s-immigrants-from-el-salvador-guatemala-and-honduras-outpaces-growth-from-elsewhere/. and the availability of better economic opportunities in the U.S. played a major role in this uptick of immigration. These factors were likely complemented by the “network effect,” which is the chance to join relatives and family who have already migrated.
Host States of Unauthorized Immigrants
The largest host states in 2014 were California, Texas, Florida, New York, Illinois and New Jersey.Charts (from 2005-2014) for this section and the following section are available from the authors on request. Among these states, California (2.9 million) and Texas (1.9 million) together accounted for 40 percent of the total U.S. unauthorized immigrant pool in 2014. This is not surprising given that these two states share borders with Mexico, the largest source for unauthorized immigrants.
These same top six states accounted for 59.7 percent of unauthorized immigrants in 2014. They had the largest shares in 1990 as well, although the rank of the bottom four states was different (New York, Florida, Illinois and New Jersey).
All these states saw an increase in the pool of unauthorized immigrants, but the rise in Texas is probably the most remarkable. Texas went from hosting 440,000 in 1990 to hosting 1.9 million in 2014, which was more than a fourfold increase. California started in 1990 with a much larger pool of 1.5 million and had 2.9 million in 2014, experiencing less than a twofold increase. Florida, New York, Illinois and New Jersey also experienced sharp growth in the share of unauthorized immigrants, with New Jersey experiencing the most growth (a fivefold increase from 1990), and New York experiencing the least growth (less than twofold).
Unauthorized Immigrant Deportations
In 1990, deportations totaled around 30,000, which was around 0.9 percent of the total pool of unauthorized immigrants at the time. Deportations peaked at 433,000 in 2013, which was 3.6 percent of the unauthorized immigrant pool that year. Viewed through a longer lens, deportations have steadily increased both in absolute and relative terms since 1990, from 188,000 (2.2 percent of the pool) in 2000 to 340,000 (3.0 percent) in 2016. As mentioned earlier, U.S. enforcement has gone up in recent years compared with enforcement in the early 2000s, which has probably led to a greater proportion of unauthorized migrants being detected and deported.
Conclusion
Unauthorized immigration to the U.S. has dominated the news in recent years. While it increased rapidly in the 1990s until the time of the Great Recession, recent data show a leveling off of unauthorized immigration and indeed a modest reduction from the 2014 peak. The net inflow from Mexico has often been negative on a year-to-year basis since the onset of the Great Recession. This may be due to the lack of adequate economic opportunities in the U.S. relative to those in Mexico, or a more effective or activist enforcement policy. Regardless, the future evolution of unauthorized immigration in the U.S. will depend on a combination of these factors.
Endnotes
- “Foreign-born” is defined by the Census Bureau as anyone who is not a U.S. citizen at birth. Details are available at www.census.gov/topics/population/foreign-born.html.
- See Passel et al., and Massey.
- In 2012 dollars, CBP’s budget increased from $7.4 billion to $11.7 billion.
- See Meissner et al.
- See www.pewhispanic.org/2013/09/25/2011-national-survey-of-latinos/; and www.pewhispanic.org/2017/12/07/rise-in-u-s-immigrants-from-el-salvador-guatemala-and-honduras-outpaces-growth-from-elsewhere/.
- Charts (from 2005-2014) for this section and the following section are available from the authors on request.
References
Department of Homeland Security. Aliens Removed or Returned: Fiscal Years 1892 to 2016.
Massey, Douglas S. Immigration and the Great Recession. A Great Recession Brief, Russell Sage Foundation and Stanford Center on Poverty and Inequality, October 2012.
Meissner, Doris; Kerwin, Donald M.; Chishti, Muzaffar; and Bergeron, Claire. Immigration Enforcement in the United States: The Rise of a Formidable Machinery. Washington, D.C.: Migration Policy Institute, 2013.
Passel, Jeffrey S.; and Cohn, D’Vera. U.S. Unauthorized Immigration Flows Are Down Sharply Since Mid-Decade. Washington, D.C.: Pew Research Center, 2010.
Passel, Jeffrey S.; Cohn, D’Vera; and Gonzalez-Barrera, Ana. Net Migration from Mexico Falls to Zero—and Perhaps Less. Washington, D.C.: Pew Research Center, 2012.
Warren, Robert; and Warren, John Robert. Unauthorized Immigration to the United States: Annual Estimates and Components of Change, by State, 1990 to 2010. International Migration Review, Vol. 47, No. 2, pp. 296-329.


Views expressed in Regional Economist are not necessarily those of the St. Louis Fed or Federal Reserve System.
For the latest insights from our economists and other St. Louis Fed experts, visit On the Economy and subscribe.
Email Us