


A Look Back at Regional Economic Performance before COVID-19
KEY TAKEAWAYS
- New data show how different U.S. regions performed in 2019, with economic growth strong in some places but weak or contracting in others.
- Counties in the Western states, south Texas and Florida had the strongest growth, while those in the Midwest and northern Plains did not.
- Growth in the Fed’s Eighth District continued to lag the national average, growing just less than half the national rate—or 1%—prior to COVID-19.

In early December, the Bureau of Economic Analysis released estimates of real gross domestic product (GDP) by county and metropolitan statistical area (MSA). These new data provide an opportunity to review how different regions of the U.S. performed.
They also allow a look back at the economy before the COVID-19 pandemic began, as regional real GDP data are released with about a one-year lag. While this picture may seem a much brighter-than-expected review of the months preceding 2020, these data highlight regional disparities in growth that may still persist today or return as the economy recovers from the pandemic.
The data portray an economy comprising very different regional trends in 2019. In the best areas, growth was strong and accelerating, while in others, the economy was already decelerating or even experiencing a prolonged contraction.
Slow Growth Pre-Pandemic
Overall real GDP growth slowed to an annual rate of 2.2% in 2019—down from 3% in 2018—a rate slightly below average during the economic expansion of 2010-19. (See the table below.)
| Region | 2010-19 | 2018 | 2019 |
|---|---|---|---|
| U.S. | 2.3% | 3.0% | 2.2% |
| U.S. (Metro Portion) | 2.3% | 3.1% | 2.1% |
| Eighth District | 1.0% | 1.7% | 1.0% |
| Eighth District (Metro Portion) | 1.1% | 1.9% | 1.1% |
| Largest Eighth District MSAs | |||
| Little Rock, Ark. | 0.7% | 1.5% | 0.9% |
| Louisville, Ky. | 1.9% | 1.7% | 1.6% |
| Memphis, Tenn. | 1.0% | 2.0% | 0.1% |
| St. Louis | 0.7% | 2.0% | 1.0% |
| SOURCE: Bureau of Economic Analysis. | |||
| NOTE: 2010-19 represents annual average growth rate. | |||
What these aggregate numbers hide is the fact that just over half of the counties in the U.S. (53%) experienced an acceleration in growth between 2018 and 2019. Moreover, differences in the rate of growth across the U.S. were vast: About one-fourth of counties experienced growth over 4% in 2019, while about one-fifth of counties experienced a contraction, or negative real GDP growth.
A map of this data using GeoFRED® shows that counties in Western states, southern Texas and Florida experienced the strongest growth in 2019, while the counties in the Midwest and northern Plains states experienced slower growth, or contraction.
Metro Areas Continued Outperforming
Driving the slower growth in the U.S. in 2019 was the deceleration of growth in the metropolitan portion, which accounts for about 90% of U.S. economic output. MSAs generally outperformed the nonmetro (or rural areas) of the country during the 2010-19 expansion.See "Industry Mix May Help Explain Urban-Rural Divide in Growth" for more information on the differences in growth rates between rural and urban areas.
The metropolitan portion of the nation experienced a slowing of growth, from 3.1% in 2018 to 2.1% in 2019. Again, however, the differences across the nation’s MSAs are substantial: 10% of all metro areas reported growth rates above 4%. Those experiencing faster growth were, on average, slightly larger metro areas. The fastest-growing metro area was Midland, Texas, at 18.7% growth. A map of this data using GeoFRED® shows that concentrations of the fastest-growing metros are predominantly in the Western states and Florida.
A Closer Look at the Eighth District
Economic growth in the Eighth DistrictHeadquartered in St. Louis, the Federal Reserve’s Eighth District includes all of Arkansas and parts of Illinois, Indiana, Kentucky, Mississippi, Missouri and Tennessee. continued to lag the national average during 2019, growing at just less than half the national rate at 1% and slowing from 1.7% in 2018. Underperformance in the District’s MSAs is the key contributor to this slower growth rate.
The 20 MSAs in the District, which account for 70% of the region’s economic output, experienced 1.1% real GDP growth in 2019, down from 1.9% in 2018. The District’s fastest-growing MSA during the previous economic expansion, the Fayetteville (Ark.-Mo.) MSA, averaged 3.9% growth from 2010 to 2019, but saw growth slow to 0.6% in 2019. On the other hand, Pine Bluff, Ark., averaged real GDP growth of -1.1% during 2010-19, and experienced a further contraction in economic activity of -1.6% in 2019.
Among the four largest MSAs in the District, trends were similar to the nation, with growth decelerating from 2018 to 2019, although to a lesser degree in the Louisville, Ky., MSA. Memphis, Tenn., experienced a sharp deceleration, from 2% to 0.1% growth in 2019.
National and District Growth Comparison
The figure below shows the distribution of growth in 2019 across U.S. counties (red area) and Eighth District counties (blue area). The two distributions overlap each other to a great degree, indicating that growth in most counties was similar.
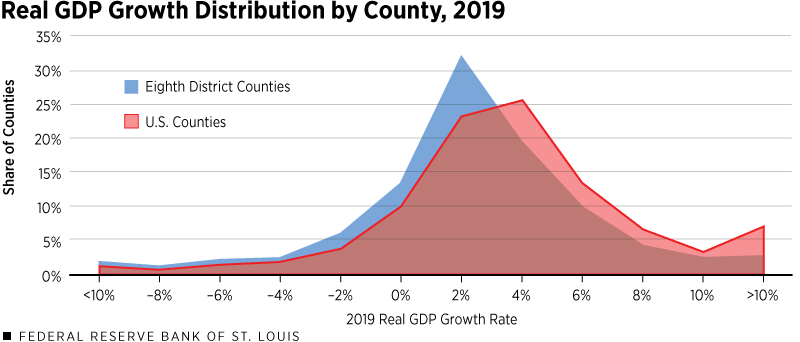
Many counties in the U.S. and Eighth District grew at a rate near the national average of 2.2% in 2019. The District distribution skews toward slower growth, and the mode (or peak of the distribution) is at a lower growth rate. The tails on both distributions are wide, indicating the share of counties with contracting activity (left tail) and booming growth (right tail).
In 2019 about 20% of counties in the U.S. and 28% in the District averaged negative economic growth. At the same time, many counties experienced double-digit growth—just over 7% of counties nationally and 3% in the District.
Regional Growth, Now and in the Future
Most regions of the country follow a similar business cycle of expansion and contraction. For many regions, we can expect data for 2020 to show a significant contraction in economic activity. Differences in industry composition, for example, may amplify the degree of the economic downturn or the rate of recovery.See "The Role of Industry Mix in Regional Business Cycles" for more information.
Moreover, structural variation across regions from legacy industries, demographics or migration can generate significant differences in the trend rate of growth over longer periods. Although 2010-19 was one of the longest economic expansions in U.S. history, often characterized by slow and steady growth, a glimpse at a specific county can paint a very different picture. Almost one in five counties in the U.S. averaged negative economic growth between 2010 and 2019, while just over 2% of counties averaged double-digit growth at or above 10% during the same period.
During 2020, many people have found themselves looking at state- and county-level maps tracking the spread of the COVID-19 pandemic and reading news stories about how significantly different health and economic conditions appear from one region to the next.
Moreover, differences in policy responses by state and local governments to contain the virus have seemingly impacted the magnitude of the downturn and pace of recovery. The Survey of Professional Forecasters projects that U.S. real GDP is expected to grow at 3.2% in 2021, and remain around that rate into 2022 and 2023. However, based on the dispersion in growth during the last economic expansion, and most recently in 2019, it is reasonable to expect some regions to boom while others continue to contract.
Endnotes
- See "Industry Mix May Help Explain Urban-Rural Divide in Growth" for more information on the differences in growth rates between rural and urban areas.
- Headquartered in St. Louis, the Federal Reserve’s Eighth District includes all of Arkansas and parts of Illinois, Indiana, Kentucky, Mississippi, Missouri and Tennessee.
- See "The Role of Industry Mix in Regional Business Cycles" for more information.

Views expressed in Regional Economist are not necessarily those of the St. Louis Fed or Federal Reserve System.
For the latest insights from our economists and other St. Louis Fed experts, visit On the Economy and subscribe.
Email Us