


COVID-19 Containment Measures, Health and the Economy
KEY TAKEAWAYS
- Containment measures early in the pandemic were associated with a short-term rise in the national unemployment rate, which reached 14.8% in April 2020.
- Although most states with higher COVID-19 stringency measures last year saw unemployment rise from March to June, most rates fell from July to October.
- Data suggest that states with stricter measures had faster labor market recoveries and better health outcomes than those with looser controls.

COVID-19 containment measures such as lockdowns and restrictions on contact-intensive businesses and indoor operations were prevalent in 2020. Early in the pandemic, many states mandated school and business closures and issued stay-at-home orders to help control the new virus. Soon after, in April, the national unemployment rate peaked at 14.8%.
While the goal of these measures was to curb the virus, they were controversial because they often conflicted with the economic costs of doing so. This article investigates the extent to which COVID-19 containment measures involved a trade-off between health and economic outcomes. To do so, we explored policy responses to the pandemic across U.S. states and examined their implications for health and economic outcomes.
We used data from the Oxford COVID-19 Government Response Tracker (OxCGRT) to measure the restrictiveness of the containment measures implemented by each state. Specifically, we used OxCGRT’s stringency policy index, which measures the restrictiveness of a state in closing schools, workplaces, public events and movement within the state, among other measures. The index ranges from 0 to 100, with higher values indicating higher restrictiveness.
Containment Measures and Health Outcomes
First, we examined the relationship between containment measures and health outcomes. We investigated whether states that were more willing to implement these measures also experienced a milder spread of the virus.
The figure below plots the relationship between each state’s maximum monthly stringency index between March and October and the average number of weekly cases per million inhabitants.All the figures and regression lines presented in this article weight states by their 2019 populations.
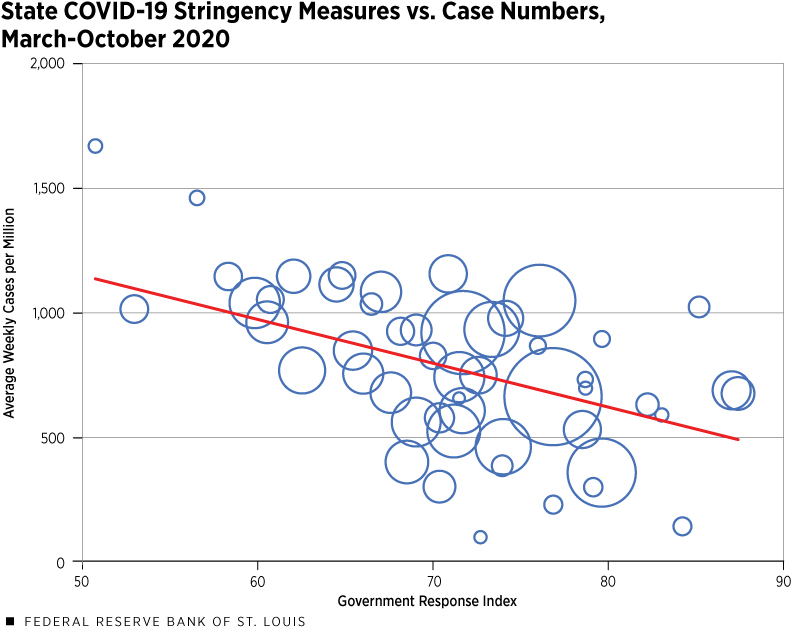
SOURCES: OxCGRT and the Centers for Disease Control and Prevention (CDC).
NOTE: This figure plots the average number of weekly COVID-19 cases normalized by population in a state against the maximum stringency index from March 2020-October 2020. States with stricter stringency measures experienced fewer coronavirus cases. Calculations include the District of Columbia.
We found a strong negative relationship between government measures to curb COVID-19 spread and COVID-19 cases. This evidence suggests that stricter containment measures were likely to have been effective at curbing the virus.
Containment Measures and Economic Outcomes
Next, we examined the economic impact of these containment measures. We investigated whether states with stricter containment measures experienced a more severe increase in unemployment. The second figure below plots the relationship between each state’s maximum stringency index between March and October and the change in the state’s unemployment rate over this period.
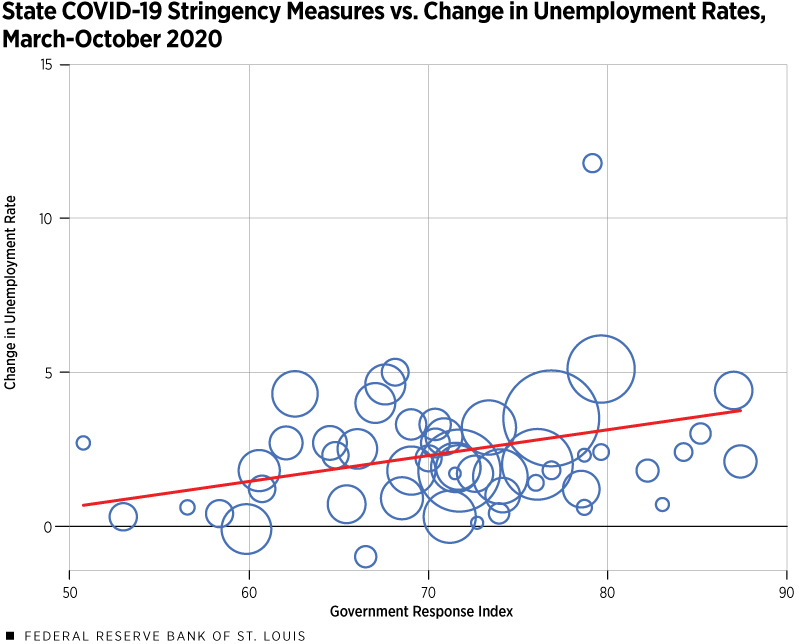
SOURCE: Bureau of Labor Statistics and OxCGRT.
NOTE: This figure plots the maximum stringency index in a state against the change in the unemployment rate from March 2020-October 2020. The positive relationship implies that states with larger stringency measures experienced larger employment losses during this period. Calculations include the District of Columbia.
We found that states more willing to undertake restrictive measures to control the pandemic also experienced a higher increase in the unemployment rate. Thus, there does appear to be a trade-off between the economic and health outcomes caused by COVID-19 containment measures.
However, this figure masks two sharply different periods for the economic dynamics experienced during the pandemic. The first period, from March to June, is characterized by a sharp increase in the unemployment rate at the national and state levels—a period during which the pandemic was novel, uncertainty was high and, as a result, governments implemented bold measures designed to contain the virus by shutting down significant economic sectors.
The second period, from July to October, is characterized by a widespread decline in the unemployment rate as most states reopened their economies with varying levels of health controls.
A Closer Look at Stringency Measures and Employment
Last, we examined the relationship between containment measures and economic outcomes during each of these periods. The third figure, which comprises two panels, plots the maximum stringency index observed in each period against the change in the unemployment rate from the beginning to the end of each period. The top panel presents our findings for the March-June period, while the panel below reports the values for the July-October period.
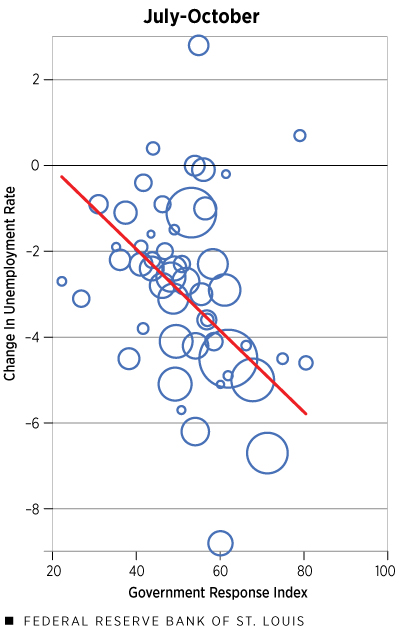
As in the second figure above, the top panel below shows that states with stricter containment measures against the virus between March and June experienced larger employment losses. In contrast, the bottom panel below shows that the reverse is the case for the July-October period: States with stricter containment measures experienced sharper reductions in the unemployment rate than their counterparts with less restrictive measures.
COVID-19 Stringency Measures and Changes in Employment across Periods
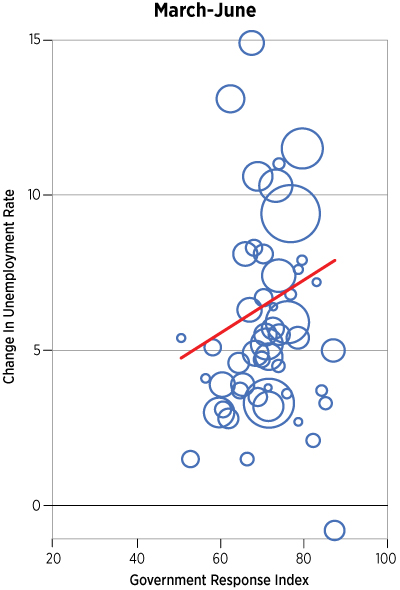
SOURCES: Bureau of Labor Statistics and OxCGRT.
NOTE: This figure plots the maximum stringency index in a state against the change in unemployment rate within two separate time windows. Early in the pandemic, stringency measures were correlated with employment loss, but later in 2020, labor markets with tougher stringency measures recovered more rapidly. Calculations include the District of Columbia.
States with the strictest measures in the first period experienced the largest increases in the unemployment rate. These same states generally kept strict containment measures in place during the second period.
While skeptics of the effectiveness of containment measures might have expected these states to underperform their counterparts with less restrictive measures, we found the reverse to be true. States with the strictest measures experienced a faster labor market recovery than states with looser controls to contain the virus during the latter half of 2020.
Conclusion
Our findings suggest that, while containment measures may have had a larger economic impact in the short term (top panel of the third figure), they also might have allowed labor markets to recover rapidly (bottom panel of the third figure), often at a rate faster than states with less stringent measures.
This evidence suggests that the strict containment measures introduced to control the spread of COVID-19 might not hurt the economy in the long term; rather, these measures were associated with a lower spread of the virus and with a transitory short-term economic shock. Our findings imply that if the relationship between the recovery and stringency measures holds, in the medium term, there might not be a tradeoff between the health and economic implications of these measures.
However, we would like to emphasize that one limitation of our analysis should be kept in mind: While differences in containment measures might be associated with different economic outcomes, they are also associated with different levels of virus spread, making it difficult to identify whether the measures or the virus spread drives economic outcomes. However, our findings imply that regardless of which is the case, containment measures might be desirable, since they are associated with better health outcomes at a transitory economic cost.


Views expressed in Regional Economist are not necessarily those of the St. Louis Fed or Federal Reserve System.
For the latest insights from our economists and other St. Louis Fed experts, visit On the Economy and subscribe.
Email Us