District Overview: Reallocation of Credit, a Measure of Financial Activity, Has Yet To Bounce Back
Each year, while thousands of businesses grow and succeed, many others weaken and shut down. These dynamics, in turn, are reflected in the flow of factors of production (i.e., labor and capital) that are constantly being reallocated among businesses.
As stated by University of Maryland economics professor John Haltiwanger, the sorting of successful business endeavors from unsuccessful ones is a central and necessary part of our market economy, and it is essential that the public and policymakers understand this process.1
Our previous studies show that the reallocation of employment has been low in the current recovery compared with what happened in past recoveries.2 Business Employment Dynamics data from the Bureau of Labor Statistics reveal that employment turnover was significantly lower following the Great Recession than following the former two recessions, in 2001 and 1990. The same trend appears in the creation of startups.3 By the first quarter of 2010, business closings declined to prerecession levels for both the nation and the Eighth District, but business formations were slower to recover.
Although these studies analyze the behavior of the labor market and small firms (those entering and exiting), little is known about reallocation of resources among larger, more-established firms. This article concentrates on credit flows among publicly traded firms at the national level and also examines a sample of firms headquartered in the Eighth District. Studying the reallocation of financial resources (e.g., credit) is important: Economists Jith Jayaratne and Philip Strahan argued in their 1996 study that the intrastate branching reform in the United States played an important role in economic growth by improving the allocation of capital.4
To understand the definition of credit reallocation, we need to introduce two related concepts: credit creation and destruction.5 Credit creation is the sum of debt of firms with rising debt plus debt of newborn firms. Credit destruction is the sum of debt of firms with shrinking debt plus the debt of closing firms. Credit reallocation, instead, is the sum of credit creation and destruction. To illustrate, imagine an economy with only two firms. If one firm increases its debt from $75 to $125 and another firm decreases its debt from $125 to $75, the net change in total debt would be $0. However, credit reallocation would be $100 (or 50 percent when calculated as in Herrera et al.). The analysis hereafter will focus on the reallocation of total debt.
Credit reallocation is computed at the national and Eighth District levels using Standard and Poor's Compustat. The measure of debt considered, total debt, is defined as total liabilities. The sample size for the nation is 21,493 companies, including Wal-Mart, Exxon Mobil, Chevron, Conoco-Phillips, General Electric and General Motors. The sample for the District includes only 68 firms headquartered within the Eighth District boundaries. Among them are Wal-Mart, International Paper, FedEx, Emerson, Tyson Foods and Murphy Oil.
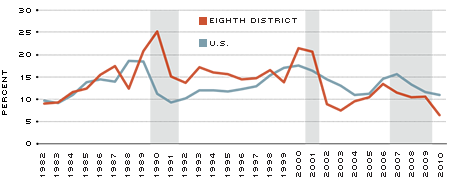
Credit Reallocation: Nation and District

SOURCE: Authors' calculations from Standard and Poor's Compustat data.
NOTE: Time series were smoothed using a two-period moving average process. Shaded areas are years in which at least part of a recession was experienced, according to the National Bureau of Economic Research (NBER).
The strength of economic activity is usually reflected by high reallocation of credit. Figure 1 shows the evolution of reallocation during the past 30 years.6 For each economic cycle since 1982, the maximum growth of reallocation is reached just before or shortly after the beginning of the recession. Specifically, credit reallocation peaked in the U.S. at rates of 19 percent, 17 percent and 16 percent in 1988, 2000 and 2007, respectively. The same pattern is depicted in the Eighth District, where credit reallocation rates reached 25 percent, 21 percent and 13 percent in 1990, 2000 and 2006, respectively.7 During the latest economic downturn, the rate of credit reallocation in the nation decreased by roughly one-third, while for the District the drop was even higher, declining to half of the prerecession level. This pattern is similar to what happened around the previous two recessions.
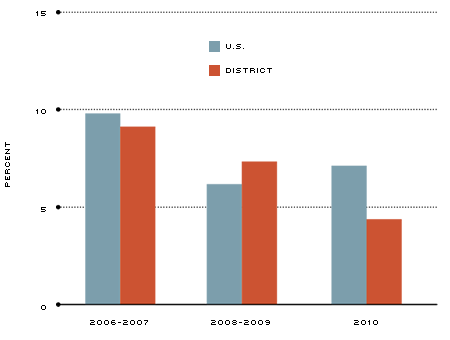
Average Annual Credit Creation

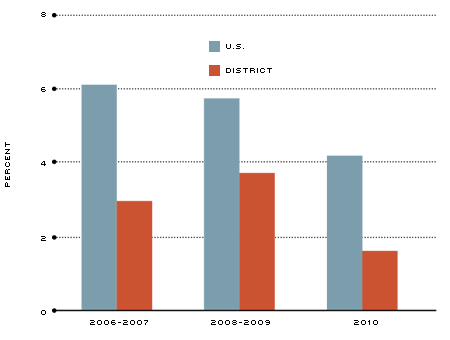
Average Annual Credit Destruction

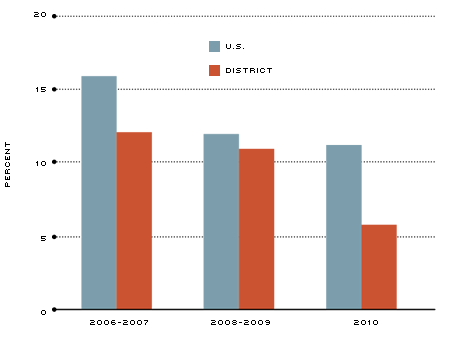
Average Annual Credit Reallocation

SOURCE: Authors' calculations from Standard and Poor's Compustat data.
Figure 2 decomposes reallocation into credit creation and destruction from 2006 through 2010. The top panel of the figure displays average annual levels of credit creation for three periods: 2006-2007 (the economic peak before the Great Recession), 2008-2009 (a period affected by the Great Recession) and 2010 (a period of economic recovery). Blue and red bars represent credit creation in the nation and the District, respectively. The middle and bottom panels display the same information for credit destruction and credit reallocation.
The weakness of credit reallocation experienced since the latest recession started is evident in the nation and the District. At the national level, creation of credit increased in 2010 to 7 percent but was far from its prerecession level. In contrast, credit destruction appears to have experienced a declining trend: Destruction of credit was 8 percent in 2006 and 4 percent in 2010.
Firms headquartered in the Eighth District also experienced a negative trend in credit reallocation despite the increase in credit destruction during the recession. In 2010, credit reallocation was significantly lower than in 2008-2009—a decrease of roughly 48 percent—due to very low levels of both credit creation and destruction. While credit creation decreased by 44 percent, credit destruction decreased by 55 percent in the District during this period.
The evidence above suggests that by the end of 2010 credit markets had not yet recovered to prerecession levels of dynamism, as measured by reallocation of credit among firms in the nation and the Eighth District. This trend, together with evidence of weak reallocation of employment and sluggish startup activity, seems to indicate that economic activity as of the end of 2010 had not yet recovered its previous strength.
Endnotes
- See Haltiwanger. [back to text]
- See Liborio and Sánchez, 2012a. [back to text]
- See Liborio and Sánchez, 2012b. [back to text]
- See Jayaratne and Strahan. [back to text]
- This article follows the methodology in Herrera et al. [back to text]
- The time series displayed was smoothed using a two-period moving average process. [back to text]
- District statistics display higher volatility due to their smaller sample size. [back to text]
References
Haltiwanger, John. "Job Creation and Firm Dynamics in the U.S." Unpublished manuscript, May 2011. See http://econweb.umd.edu/~haltiwan/c12451.pdf
Herrera, Ana M.; Kolar, Marek; and Minetti, Raoul. "Credit Reallocation," Journal of Monetary Economics, Vol. 58, 2011, pp. 551-63. See www.clas.wayne.edu/multimedia/usercontent/File/herrera/HKM_JME.pdf
Jayaratne, Jith; and Strahan, Philip E. "The Finance-Growth Nexus: Evidence from Bank Branch Deregulation." The Quarterly Journal of Economics, Vol. 111, No. 3, 1996, pp. 639-70. See www.jstor.org/stable/pdfplus/2946668.pdf
Liborio, Constanza S.; and Sánchez, Juan M. "Employment Dynamics during Economic Recoveries." Economic Synopses, Federal Reserve Bank of St. Louis, January 2012a. See http://research.stlouisfed.org/publications/es/article/9108
Liborio, Constanza S.; and Sánchez, Juan M. "Starting a Business during a Recovery: This Time, It's Different." The Regional Economist, Federal Reserve Bank of St. Louis, January 2012b. See www.stlouisfed.org/publications/regional-economist/january-2012/starting-a-business-during-a-recovery-this-time-its-different
Views expressed in Regional Economist are not necessarily those of the St. Louis Fed or Federal Reserve System.
For the latest insights from our economists and other St. Louis Fed experts, visit On the Economy and subscribe.
Email Us


