


District Overview: Decline in House Prices Slows Down; District Still Faring Better than Nation
In the fourth quarter of 2009, Eighth District house prices, as measured by the Federal Housing Finance Agency (FHFA), fell by only 0.4 percent from the previous quarter, a much slower rate than the 1.7 percent decline between the second and third quarters. However, compared with prices from a year earlier, the decline was 2.3 percent, the largest year-over-year decline since the collapse of the housing bubble in late 2007.
Despite the fact that these declines were the largest of the current episode, the District housing market as a whole continued to outperform that of the nation. Aggregate house prices in the District did not increase as much as the nation's during the boom, and the subsequent decline has been milder. The District also reached its house price peak nearly a year after the nation and maintained prices near the peak for another year. This pattern held for the majority of major Metropolitan Statistical Areas (MSAs) within the District; they experienced an average decline from peak of less than 3 percent. In contrast, some of the largest MSAs in the country experienced price declines greater than 30 percent through the fourth quarter of 2009.
Eighth District Outperforms the Nation
Figure 1 shows the growth in house prices for the nation and the District since 2000.1 The FHFA index tracks the repeat sales of homes that are financed with conforming mortgages from Fannie Mae or Freddie Mac.2 By this measure, house prices for the United States peaked in the second quarter of 2007, with 70 percent growth since 2000. Since then, the largest two price declines have come in the third quarter of 2008 and 2009, and by the fourth quarter of 2009, prices were only 50 percent higher than they were in 2000.
In contrast, the aggregate prices for the District did not reach a peak until the first quarter of 2008 at a relative valuation much lower than that of the United States as a whole. Equally notable, District house prices declined by a much smaller percentage from their peak. Indeed, in the first quarter of 2009, house prices declined by less than a half percent. It was only in the last two quarters of 2009 that house prices began to move lower, albeit at a rate that was slower than that for the nation as a whole. It is no surprise, then, that since the first quarter of 2008, the large majority of District MSAs performed better than the nation as a whole with regard to price changes on a yearly level. The primary exception was Fayetteville, Ark., which saw similar price declines as the nation over this time period but exceeded the U.S. decline on several occasions.
FHFA House Price Index
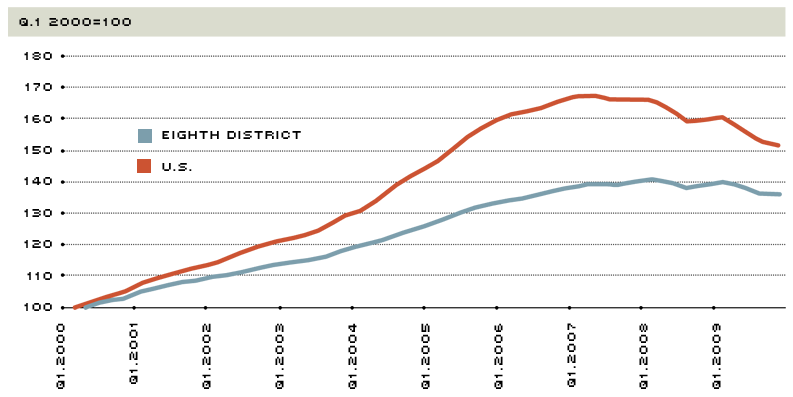
SOURCE: Federal Housing Finance Agency
SOURCE: Federal Housing Finance Agency
SOURCE: Federal Housing Finance Agency
Comparing the Rise and the Fall among Eighth District MSAs
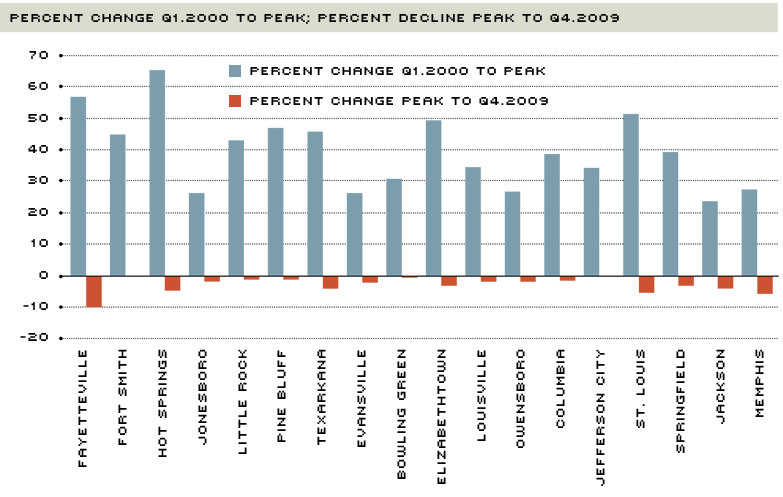
Figure 2 tells a somewhat surprising story for the District. The regions with the largest house price increases were not necessarily the regions with the largest declines. Indeed, those regions with strong population growth or employment growth might expect natural increases in house prices, in line with fundamental valuations. Other regions experienced large price declines, despite below average increases in prices since 2000.
Fort Smith, Ark., experienced the largest increase in house prices between the fourth quarter of 2008 and the fourth quarter of 2009 (which was the peak for the Fort Smith area. Jefferson City, Mo., was the only other District MSA to experience a peak in the fourth quarter). During that period, prices increased 1.8 percent; as shown in Figure 2, prices rose 45 percent since 2000, slightly above the District average of 40 percent. Without a decline in house prices, the Fort Smith metro area easily outperformed the district average of a 3 percent decline from the peak to the fourth quarter of 2009. Other MSAs that fared better than the District average in terms of growth to peak (from Q1.2000) and decline since peak (to Q4.2009) include Little Rock, Ark., (43 percent increase, 1.3 percent decline) and Pine Bluff, Ark., (46.8 and –1.3 percent, respectively).
Conversely, Fayetteville, Ark., experienced the largest decline in house prices from the peak, at 10.1 percent. This price decline was on par with major metropolitan areas like Washington, D.C., (9.1 percent), New York (12.1 percent), Boston (13.1 percent) and Chicago (14.1 percent). Within the District, Fayetteville also experienced the second-largest price increase, of nearly 57 percent between the first quarter of 2000 and the local peak in the second quarter of 2007. Other cities that exceeded the average price increase and experienced greater than average price declines were St. Louis (51.4 and –5.3 percent); Texarkana, Ark., (46 and –4.2 percent); Hot Springs, Ark., (65.5 and –4.9 percent) and Elizabethtown, Ky., (49.3 and –3.2 percent).
In contrast, only Memphis, Tenn., lagged the District average in terms of house price growth and exceeded the District average for price declines. With price appreciation
of only 27.7 percent, Memphis was the fifth-slowest growing MSA in the District; however, the relative price decline of 5 percent was the second-largest decline, behind only that of Fayetteville.
District Relative to Top 10 Metro Areas
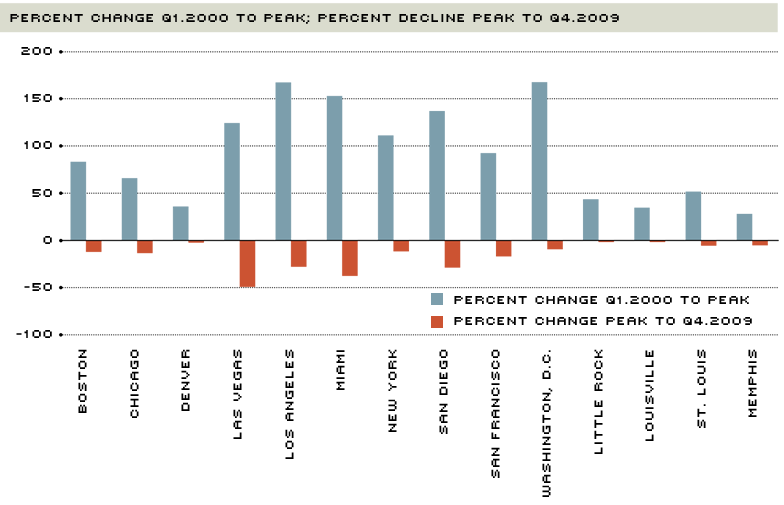
Figure 3 presents the FHFA data for the four largest District MSAs alongside the 10 MSAs that define the S&P/Case-Shiller 10-City Composite HPI.3 In this view, the District MSAs' price increases and decreases between 2000 and 2009 seem to match only those of Denver. Furthermore, this comparison reveals that the differences in performance among the District MSAs paled in comparison to the differences in performance among these 10 large non-District MSAs. Overall, the MSAs of the District exhibited lower price fluctuations compared with several non-District MSAs. This experience suggests that when considering the performance of Eighth District house prices, it is important to consider not just the differences between District MSAs, but also consider the performance as judged against the nation as a whole.
Endnotes
- The Eighth District housing price index is calculated as the average of the 18 MSAs that report house price data, weighted by population in each MSA. The 18 MSAs are: Fayetteville, Ark.; Fort Smith, Ark.; Hot Springs, Ark.; Jonesboro, Ark.; Little Rock, Ark.; Pine Bluff, Ark.; Texarkana, Ark.; Evansville, Ind.; Bowling Green, Ky.; Elizabethtown, Ky.; Louisville, Ky.; Owensboro, Ky.; Columbia, Mo.; Jefferson City, Mo.; St. Louis, Mo.; Springfield, Mo.; Jackson, Tenn.; and Memphis, Tenn. [back to text]
- In contrast, the S&P/Case-Shiller index tracks homes that are also financed using larger or more unconventional mortgages. Furthermore, the S&P/Case-Shiller index is value weighted, so that more expensive homes influence the index more heavily; the FHFA index is unit weighted, so that regions with more housing units are more influential in the index. For a more detailed description, see Aubuchon and Wheelock. [back to text]
- The 10-City Composite index is considered a snapshot of U.S. house prices, particularly in larger regions. The Composite 10 index was used as a baseline in the Supervisory Capital Assessment Program (bank stress tests) conducted by the Federal Reserve in early 2009. [back to text]
References
Aubuchon, Craig P.; and Wheelock, David C. "How Much Have U.S. House Prices Fallen?" Federal Reserve Bank of St. Louis' National Economic Trends, August 2008, p. 1. See http://research.stlouisfed.org/publications/net/past/2008/

Views expressed in Regional Economist are not necessarily those of the St. Louis Fed or Federal Reserve System.
For the latest insights from our economists and other St. Louis Fed experts, visit On the Economy and subscribe.
Email Us