


Income Volatility as a Barrier to Food Stamp Takeup
KEY TAKEAWAYS
- Families close to the eligibility threshold for food stamps who had more volatile incomes were less likely to utilize this benefit in the years that they qualified for it.
- Families with more volatile incomes tended to experience a greater number of eligibility switches, making them less likely to invest in signing up for the program.
- Families in Eighth District states were more likely than families outside these states to be on food stamps, and they experienced more eligibility switches.
Family incomes in the United States can be extremely volatile; in 2020, for instance, almost 20% of households experienced a drop in income of 25% or more.See our May 2021 Economic Synopses article, “Childhood Income Volatility.” In that analysis, we limited our sample to households in which the head of the household was between 25 and 55 years old, and we dropped families that had a change in the number of children or adults in the labor force. Families experiencing a negative income shock often struggle to afford key goods, such as food and housing. Food stamps are an important source of insurance for people who experience income shocks, but almost 1 in 5 families do not sign up for the benefits for which they are eligible.
In this article, we show that, for families close to the food stamp income threshold, the more volatile their incomes are, the less likely it is that they will receive food stamps in the years when they are eligible. One potential cause of this phenomenon is that families with volatile incomes may switch from eligibility to ineligibility many times, making it difficult for them to know when they qualify for the program and reducing the likelihood that they sign up. Families in the Eighth Federal Reserve District are particularly exposed to this effect; 12.3% of families in the Eighth District received food stamps in 2013 versus 9% of families outside it.States are the lowest level of geographic aggregation in our source for these data, the Panel Study of Income Dynamics (PSID), so we included in our calculations any state that falls entirely or partially within the Eighth District: Arkansas, Illinois, Indiana, Kentucky, Mississippi, Missouri and Tennessee.
Determining Food Stamp Eligibility
The Supplemental Nutrition Assistance Program (SNAP), also known as food stamps, is a federal, means-tested social safety net program that aims to supplement family food budgets and help participants move toward self-sufficiency. To target the neediest families, SNAP has family income and asset thresholds that recipients must meet.
While states can, and often do, add their own rules, the federal gross income threshold for participation in the program is 130% of the federal poverty line, which is calculated based on the number of adults and children in the household. In 2013, the first year in our analysis, a family of any size couldn’t have more than $2,250 in “countable assets” to be eligible for SNAP. Countable assets are liquid assets, like money in a bank account, that can be used to purchase food; home equity and other types of assets usually are excluded. Participation in another program, such as the Temporary Assistance for Needy Families program, may also make some families categorically eligible for food stamps.
Tracking Families’ Food Stamp Eligibility and Takeup
To study the relationship between food stamp usage and income volatility, we obtained data from the Panel Study of Income Dynamics (PSID), which collects biennial information on family income, asset holdings, household structure and food stamp recipiency. The PSID follows the same set of families, and any of their members who leave to create new households, over time. Thus, we can track certain households, their program eligibility and their takeup of benefits across several years.
We followed families over the most recent six-year period in the PSID—2013 to 2019—with data available every other year. We assessed each family’s SNAP eligibility based on total household income and total household checking and savings account balances, with the poverty level determined by the size of the family unit.We treated categorically eligible families—for example, families that qualified for food stamps under another program but who otherwise would have been ineligible—as eligible if they received food stamps. We then calculated a ratio between the years that families in our sample received food stamps and the years that these families were eligible. We dropped any families from the sample who were never eligible for food stamps.
Finally, we calculated the standard deviation of each family’s income over the six-year period, a statistical measure of its volatility.Technically, we calculated the standard deviation of the log of total household income over the six years in the sample for each family. That is, we created a measure of how volatile each family’s income was over time and averaged those measures across families.
SNAP Participation and Income Volatility
The figure below demonstrates the relationship between the standard deviation of the log of total household income and the share of eligible years in which a family received food stamps. To create the binned scatter plot, we divided the standard deviation of the log of total household income into 20 equal-sized groups (or bins). Then, we plotted, in each bin, the average of this measure of income volatility and the average of the share of eligible years in which a family received food stamps. A line of best fit through the data points illustrates the negative relationship between income volatility and food stamp takeup (that is, the share of eligible years that households received SNAP benefits).
Food Stamp Takeup and Family Income Volatility, 2013-2019
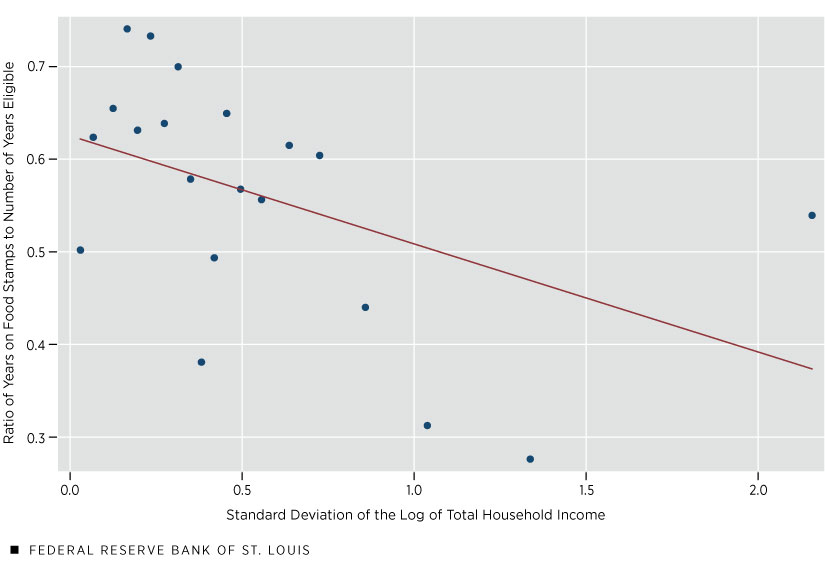
SOURCES: PSID and authors’ calculations.
The slope of the line of best fit in the above figure is -0.116; thus, going from the 25th percentile of income volatility to the 75th percentile implies an average decrease of 6 percentage points in the share of eligible years that households received food stamps. In other words, families with greater levels of income volatility were less likely to utilize the program when they were eligible.
Reasons vary: Research has shown that there is a large administrative burden associated with signing up for the program. In a survey of people eligible for SNAP but who were not receiving benefits, 40% said that they were deterred by the amount of paperwork involved in applying.See the May 2022 Center for American Progress report How to Address the Administrative Burdens of Accessing the Safety Net. States have different application processes, but generally, families must provide documentation of their income, wealth and household membership. SNAP applications are generally approved or denied within 30 days but receiving benefits may take longer. And the process must be repeated to continue qualifying for the program. Households will be less likely to pay the administrative costs of signing up for food stamps if they expect to face a future income shock that would stop them from receiving benefits.
Next, we looked at the relationship between the volatility of household income and the number of times a household crossed the SNAP eligibility threshold. We computed each family’s asset and income levels to determine its eligibility in each year and whether it changed in each period. It was possible for each family in our sample to switch across the eligibility threshold a maximum of three times (if its status changed between 2013 and 2015, 2015 and 2017, and again between 2017 and 2019). We then repeated the method employed above to create a second binned scatter plot that shows the same measure of income volatility (the standard deviation of the log of total household income) and the average number of household eligibility changes.
Switches in Food Stamp Eligibility and Family Income Volatility, 2013-2019
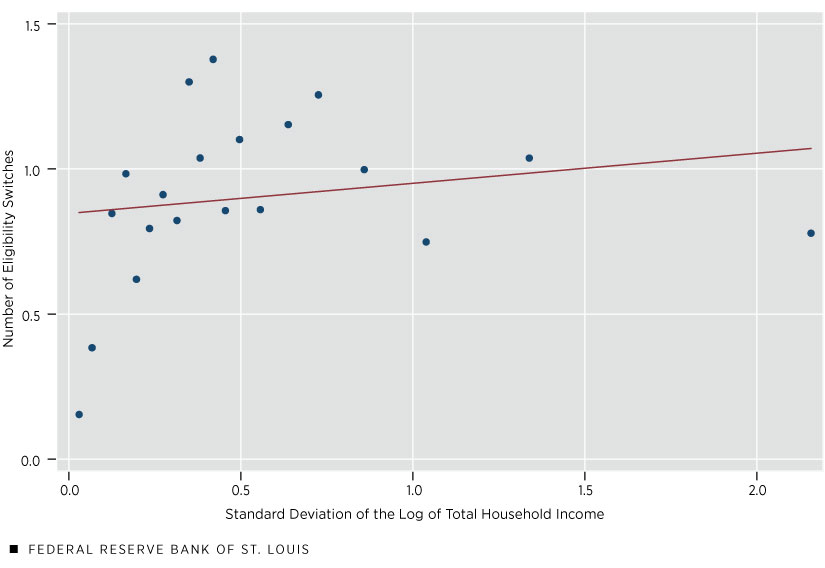
SOURCES: PSID and authors’ calculations.
The line of best fit through the data points has a slope of 0.103; thus, going from the 25th percentile of income volatility to the 75th percentile implies an average increase of 0.046 eligibility switches. Therefore, families with more volatile incomes were more likely to experience changes in eligibility. This could explain why they spent a lower proportion of the years in which they were eligible for food stamps actually receiving them.
Income Volatility Effects in the Eighth Federal Reserve District
The preceding analysis explored the relationship between income volatility and SNAP takeup across the United States. But within Eighth District states,Recall that states are the lowest level of geographic aggregation in PSID data, so in our analysis, we counted the states that fall entirely or partially within the Eighth District: Arkansas, Illinois, Indiana, Kentucky, Mississippi, Missouri and Tennessee. 12.3% of families tracked through the PSID were on food stamps at the start of our sample period in 2013, compared with 9% in other states.
To further examine trends in income volatility and food stamp usage, we compared the average values of the standard deviation of the log of total household income, the share of eligible years in which a family received food stamps, and the number of eligibility switches for families inside and outside of Eighth District states. We looked specifically at these averages based on where families were in 2013, the first year that households with at least one year of food stamp eligibility appeared in our window.
| Eighth District States | States outside the Eighth District | |
|---|---|---|
| Standard deviation of the log of total household income | 0.539 | 0.538 |
| Share of eligible years in which a family received food stamps | 0.540 | 0.569 |
| Number of eligibility switches (out of a possible three) | 0.988 | 0.870 |
| SOURCES: PSID and authors’ calculations. | ||
As the table above indicates, income volatility and the share of eligible years in which families received food stamps were similar inside and outside of Eighth District states. However, the number of eligibility switches was higher in Eighth District states. Families in District states had slightly lower household income levels and much lower balances in their checking and savings accounts across the six years ending in 2019. In 2013, families in these states had asset levels 25% lower than families in states outside the District. Because of these lower asset levels, households in Eighth District states switched eligibility more often than households outside District states at the same level of income volatility.
Income Volatility May Explain Lower Food Stamp Takeup
SNAP’s stated goal is to help families achieve self-sufficiency, but remaining in the program can be difficult for families with more volatile incomes. Families with more volatile incomes had more changes in eligibility and lower rates of program takeup when eligible. Of eligible families nationwide, 18% did not participate in the program in 2019, and one potential reason may be the volatility of their incomes. This is particularly relevant for the Eighth District, where families are more likely to be on food stamps.
Notes
- See our May 2021 Economic Synopses article, “Childhood Income Volatility.” In that analysis, we limited our sample to households in which the head of the household was between 25 and 55 years old, and we dropped families that had a change in the number of children or adults in the labor force.
- States are the lowest level of geographic aggregation in our source for these data, the Panel Study of Income Dynamics (PSID), so we included in our calculations any state that falls entirely or partially within the Eighth District: Arkansas, Illinois, Indiana, Kentucky, Mississippi, Missouri and Tennessee.
- We treated categorically eligible families—for example, families that qualified for food stamps under another program but who otherwise would have been ineligible—as eligible if they received food stamps.
- Technically, we calculated the standard deviation of the log of total household income over the six years in the sample for each family. That is, we created a measure of how volatile each family’s income was over time and averaged those measures across families.
- See the May 2022 Center for American Progress report How to Address the Administrative Burdens of Accessing the Safety Net.
- Recall that states are the lowest level of geographic aggregation in PSID data, so in our analysis, we counted the states that fall entirely or partially within the Eighth District: Arkansas, Illinois, Indiana, Kentucky, Mississippi, Missouri and Tennessee.


Views expressed in Regional Economist are not necessarily those of the St. Louis Fed or Federal Reserve System.
For the latest insights from our economists and other St. Louis Fed experts, visit On the Economy and subscribe.
Email Us