


International Shipping Costs: Determinants and Outlook
KEY TAKEAWAYS
- Short-term fluctuations in the demand for and the supply of global shipping services are key determinants of international shipping costs.
- An increase in shipping demand and a rise in shipping prices during the COVID-19 pandemic led to higher containership earnings and more orders for new vessels.
- As containerships ordered throughout the pandemic are delivered, excess demand for global shipping services should recede, further easing pressure on shipping prices.
Following the outbreak of COVID-19, the global economy experienced widespread supply chain disruptions and an unprecedented rise in international shipping costs. These developments have limited access to internationally traded goods while contributing to higher inflation.See Maggie Isaacson and Hannah Rubinton’s 2022 Federal Reserve Bank of St. Louis working paper, “Shipping Prices and Import Price Inflation,” for more about the impact of shipping costs on inflation, and see Ana Maria Santacreu and Jesse LaBelle’s 2022 Review article, “Global Supply Chain Disruptions and Inflation during the COVID-19 Pandemic,” for more about the impact of supply chain disruptions on inflation.
In this article, we investigate the determinants of international shipping costs. First, we explain how proxies of demand and supply account for shipping cost dynamics. Then, we use forecasts of these factors to evaluate the likely path of international shipping costs over the next few years.
What Are the Determinants of International Shipping Costs?
International shipping prices are set the same way as in any typical market: through supply and demand. St. Louis Fed economist Fernando Leibovici explains some of the factors shaping the market for global shipping services.

Leibovici: International shipping costs are determined the same way as in any typical economic market, as the equilibrium outcome between supply and demand.
In the case of the international shipping industry, we can think of supply as captured by the total number of ships that are available at any one point in time for transporting goods across countries, while demand can be approximated by looking at global GDP.
So take a given shipping price and examine the supply and demand for shipping at that price. If demand exceeds supply, then the equilibrium price needs to be higher to ration the high demand for shipping services across a fleet that is limited in the short run.
Similarly, if supply exceeds demand, then shipping prices need to be lower, as there is not sufficient demand for shipping services at such prices.
So over the period from 2007 to 2022, changes in international shipping prices have been highly correlated with changes in the difference between demand and supply.
In other words, what we found is that changes in international shipping prices and supply and demand tend to track each other quite closely.
Analytical Framework
In our analysis of international shipping costs, we considered global shipping demand to be decreasing with higher shipping costs, because households and firms are likely to reduce the amount they demand when prices rise. On the other hand, we considered global shipping supply to be increasing with higher shipping costs, because shippers are likely to enlarge shipping capacity if prices are higher.
Critically, the steepness of the supply curve depends on the time horizon; it might not be possible for shipping supply to increase much in the short term because building new ships takes time. We interpreted observed shipping costs as the equilibrium price that equates global demand with global supply. The implication is that fluctuations in either demand or supply will change equilibrium shipping costs.
How Did the COVID-19 Pandemic Impact Global Shipping?
Demand for international shipping rose during the COVID-19 pandemic and supply has not caught up. St. Louis Fed economist Fernando Leibovici explains how the construction lag for building new containerships has affected global shipping prices.
Leibovici: So shipping demand outstripped supply following the COVID-19 pandemic. This has resulted from unprecedented fiscal stimulus provided by governments to mitigate the cost of the pandemic, as well as by the relocation of demand from services toward durable goods.
So while the rise of demand took place over the course of just a few months, shipping supply has not been able to respond as quickly.
This is because the shipping fleet was already near full utilization, and it takes between two to four years to build new containerships.
So what we've seen in the shipping industry is two developments.
First, we've seen an increase of shipping prices, which has allowed shipping companies to ration their limited supply across the massive rise of demand.
And second, we've seen investment in building new ships, but we have yet to see these ordered containerships finish construction and get added to the fleet.
But as long as demand stays strong and until new ships become operational, we would expect shipping prices to remain high.
On the other hand, as new ships get completed and added to the fleet, it should ease some of these supply pressures, and costs are likely to fall.
Historical Dynamics of International Shipping Costs
We examined the recent dynamics of international shipping demand and supply from the lens of this framework. As a proxy for shipping demand over time, we used cross-country gross domestic product (GDP) data from the World Economic Outlook, which is published by the International Monetary Fund (IMF).Data in the IMF’s World Economic Outlook database are collected at the country level. To produce an aggregated GDP estimate, we calculated the sum of nominal GDP (in U.S. dollars) in each year from 2007 to 2022 for all countries with data over the entire period. We focused on “global” GDP as our proxy for demand because it is likely to capture fluctuations in economic activity and aggregate demand for goods, while being less affected by changes in international shipping costs than a more direct measure of shipping demand, such as aggregate imports, would be.Our findings were robust to using aggregate imports as our proxy for demand. We proxied international shipping supply using data from Clarksons Research on the size of the global containership fleet (measured in 20-foot equivalent units, or TEUs).Specifically, data are from the Clarksons Research Shipping Intelligence Network.
The following figure plots the year-to-year growth rate of these proxies for shipping demand and supply for the period from 2007 through the second quarter of 2022. The demand for shipping services (i.e., GDP) is significantly more volatile than international shipping supply (i.e., the amount of containership capacity). The figure shows periods in which the demand for shipping has grown significantly faster than shipping supply, as well as periods in which they have both grown at similar rates.
Global Shipping Demand and Supply, 2007-2022
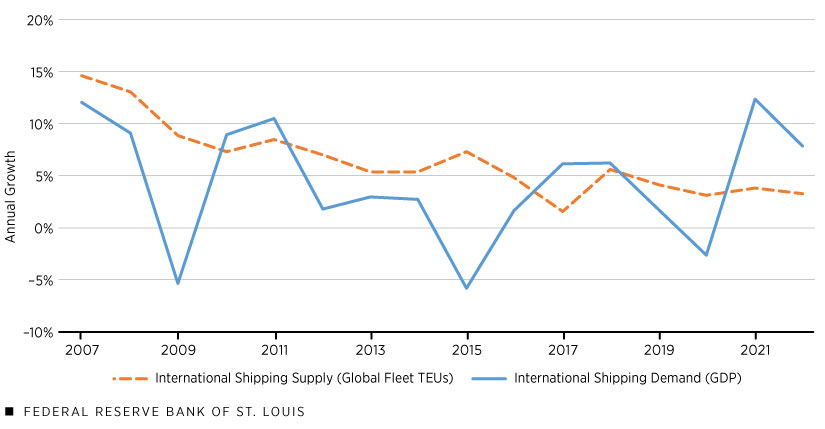
SOURCES: IMF, Clarksons Research and authors’ calculations.
The next figure plots (1) the difference between the growth rates of these shipping demand and supply determinants, which we refer to as shipping excess demand, and (2) international shipping costs. We measured the latter using data on global containership spot rates.Global containership spot rates are from Drewry’s World Container Index, which expresses shipping prices in U.S. dollars per 40-foot container. Periods in which demand for shipping grew faster than supply (an increase in shipping excess demand) are generally associated with shipping cost increases. And indeed, the figure shows that these series track each other closely, with a correlation of 0.65. To the extent that the global fleet is near full utilization, shippers ration short-run excess demand by raising prices.
Global Shipping Excess Demand and Shipping Prices, 2007-2022
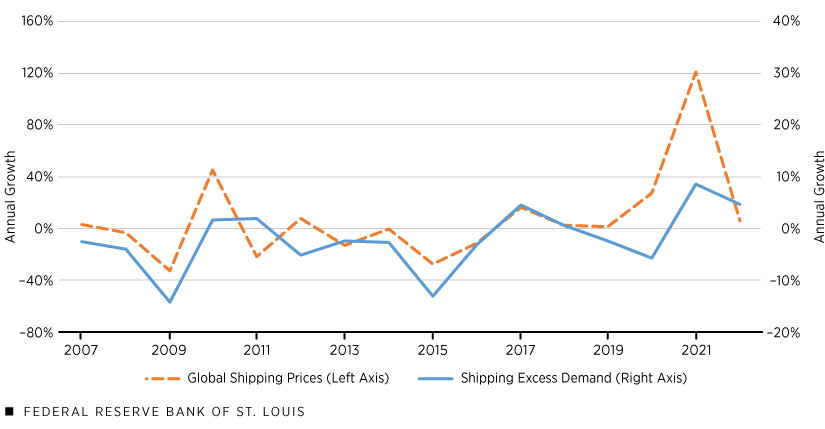
SOURCES: IMF, Clarksons Research, Drewry and authors’ calculations.
Global Shipping throughout the COVID-19 Pandemic
As illustrated in the preceding figure, shipping demand outstripped supply following the start of the COVID-19 pandemic, substantially raising international shipping prices. The following two figures examine the implications of these developments for the international shipping industry.All series in these two figures are from the Clarksons Research Shipping Intelligence Network.
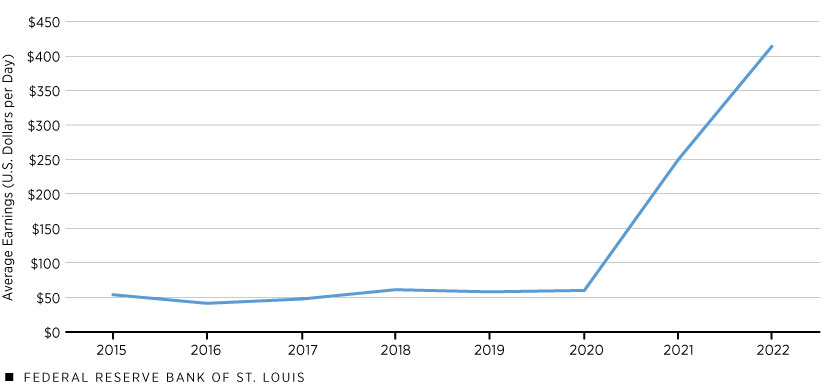
The first figure below shows that containership earnings increased astronomically over this period.The series Average Containership Earnings from Clarksons Research records average charter rates over a range of containership sizes. It captures the “theoretical earnings level” of these ships and is reported monthly. The series used month-end assessments through 2018, after which it switched to the monthly average of weekly assessments. Given these larger returns to owning containerships, global shippers increased their orders for such vessels, as observed in the second figure below. An increase of international shipping capacity should eventually increase shipping supply, decrease shipping excess demand and lower shipping prices. But this process is likely to take time, because while shippers have already placed new orders for containerships, many of these new ships have yet to be actually delivered to the fleet (as the second figure below also demonstrates).
Global Containership Earnings, 2015-2022
Global Containership Orders and Deliveries, 2015-2022
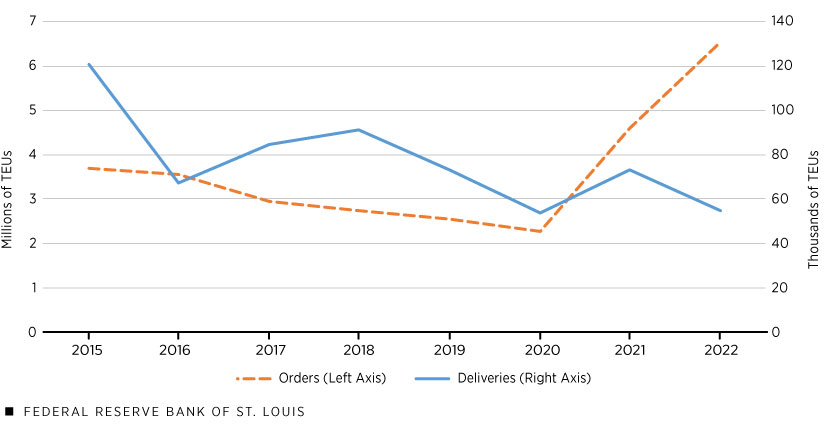
SOURCES FOR THE TWO FIGURES: Clarksons Research and authors’ calculations.
The Future of the Shipping Industry
This naturally begs the question: When should we expect to see these containerships delivered and added to the global fleet? To answer, we turned to the Clarksons Research containership orderbook, a data set that contains information on all containerships currently on order, including their size, order date and expected delivery date. These data afford us a better understanding of the estimated time between containership orders and deliveries. The following figure shows that this construction lag is about two to four years for both large and small containerships, with somewhat longer times for larger ships.
Time to Complete Containerships Currently under Construction
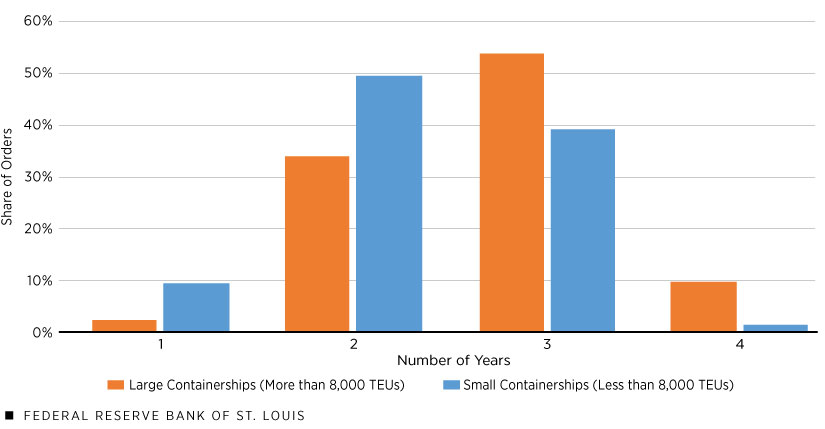
SOURCES: Clarksons Research and authors’ calculations.
NOTE: A small fraction of containerships were expected to take less than one year or five or more years to build.
What is the implication of the containership construction lag for expected international shipping prices in the coming years? Answering this question requires us to forecast future excess demand for shipping. We constructed such a forecast by combining the expected growth in international shipping supply given current containership orders and expected delivery dates with cross-country GDP forecasts from the IMF’s World Economic Outlook. The figure below plots shipping excess demand dynamics for the period from 2018 through 2024, with data points for 2023 and 2024 based on our forecast.
Actual and Forecasted Global Shipping Excess Demand, 2018-2024
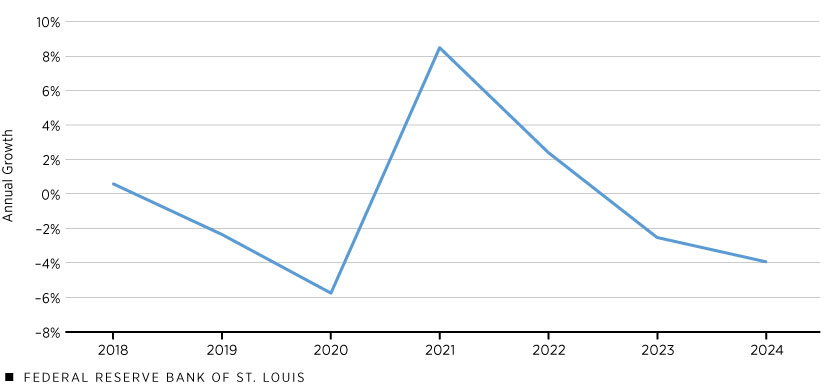
SOURCES: IMF, Clarksons Research and authors’ calculations.
Our estimates indicate that excess demand for shipping in 2023 should revert to the pre-pandemic levels observed in 2019, decreasing even further in 2024. While these patterns suggest the likely trend for international shipping prices in coming years, they do not necessarily imply that international shipping prices will fully return to pre-pandemic levels.
For instance, the massive COVID-19-related price shock may have reconfigured the global network of shipping services, as well as firms’ supply chain practices, in a way that alters observed equilibrium prices even after excess demand falls back to pre-pandemic values.
What’s the Outlook for International Shipping Costs?
Orders for new containerships jumped amid a pandemic-related rise in demand for global shipping services. But forecasts show growth in shipping demand may cool. St. Louis Fed Research Associate Jason Dunn explains how these factors could impact shipping costs.
Dunn: One way to think about the evolution of international shipping costs is by looking at the likely dynamics of both international shipping demand and supply.
That is, one could use forecasts of shipping demand and supply to get a sense of what shipping prices are looking like in the coming years.
Now, given the current orders for containerships and their expected completion dates, we expect the supply of containerships to continue rising through 2024, leading to an increase in the fleet from about 25 million TEUs now to roughly 30 million in 2024.
Using estimates of global GDP from the International Monetary Fund as a proxy, we expect global shipping demand growth to cool somewhat in the coming years, from about $103 trillion now to $117 trillion in 2024.
Combining these two estimates, we expect excess demand to fall over the next few years with the growth of supply outpacing the growth of demand. We would also expect shipping prices to decrease over the next few years.
This is pretty intuitive. The shipping industry reacted to the rise of demand early in the pandemic by raising prices. Now, once the ships ordered are added into the fleet, prices are likely to start returning to pre-pandemic equilibrium levels.
The Outlook for International Shipping Costs
Understanding the dynamics of international shipping supply, and the lags involved in the production of new containerships, is critical for understanding the forces that shape international shipping costs. As the significant number of containerships ordered throughout the COVID-19 pandemic is delivered, excess demand for shipping is likely to recede, easing pressures on international shipping costs.
Notes
- See Maggie Isaacson and Hannah Rubinton’s 2022 Federal Reserve Bank of St. Louis working paper, “Shipping Prices and Import Price Inflation,” for more about the impact of shipping costs on inflation, and see Ana Maria Santacreu and Jesse LaBelle’s 2022 Review article, “Global Supply Chain Disruptions and Inflation during the COVID-19 Pandemic,” for more about the impact of supply chain disruptions on inflation.
- Data in the IMF’s World Economic Outlook database are collected at the country level. To produce an aggregated GDP estimate, we calculated the sum of nominal GDP (in U.S. dollars) in each year from 2007 to 2022 for all countries with data over the entire period.
- Our findings were robust to using aggregate imports as our proxy for demand.
- Specifically, data are from the Clarksons Research Shipping Intelligence Network.
- Global containership spot rates are from Drewry’s World Container Index, which expresses shipping prices in U.S. dollars per 40-foot container.
- All series in these two figures are from the Clarksons Research Shipping Intelligence Network.
- The series Average Containership Earnings from Clarksons Research records average charter rates over a range of containership sizes. It captures the “theoretical earnings level” of these ships and is reported monthly. The series used month-end assessments through 2018, after which it switched to the monthly average of weekly assessments.


Views expressed in Regional Economist are not necessarily those of the St. Louis Fed or Federal Reserve System.
For the latest insights from our economists and other St. Louis Fed experts, visit On the Economy and subscribe.
Email Us