


Pandemic, Rising Costs Challenge Child Care Industry
KEY TAKEAWAYS
- The U.S. child care industry may be small in terms of wages and jobs, but it has an outsize impact on the ability of parents to participate in the labor market.
- Child care costs an estimated 14% of median household income, and the expense of child care has been rising much faster than overall prices.
- As the economy recovers and more parents return to work, declining child care capacity, combined with higher wages, could continue to push up costs.
Pandemic-related closures of schools and child care centers have reignited discussions among economists and policymakers about the caregiving economy and its outsized importance on the labor market participation of parents and caregivers.While not discussed in this essay, the caregiving economy would also include elder care at nursing homes or in-home care, which has a similar economic structure and faces similar challenges as the child care industry. In 2019, about 1 in 10 full-time workers had a child under the age of 5 who required caregiving—either because their spouse also worked full-time, or because there was no spouse at home.Sources: Census Bureau, IPUMS, authors’ calculations. This includes 9.7 million parents whose spouses work full-time (7.6% of full-time workers) and 2.3 million full-time single parents (1.8% of full-time workers).
While many young children spend time in multiple child care settings—with grandparents, older siblings or other relatives—about half spend at least some time in a licensed child care facility.Source: Center for American Progress. The center, analyzing U.S. census data, found that 47% of children under 5 spend time in licensed child care and 24% spend time in unlicensed nonrelative care. Indeed, we have seen this during the pandemic: As parents pulled their children out of child care for fear of COVID-19 exposure, shuttered businesses allowed parents to stay home and child care centers closed across the country, parents disproportionately left the labor force.See, for example, the On the Economy blog posts “COVID-19 and the Great Recession: Market Hours and Home Production across American Households” and “Family Needs Affect U.S. Labor Participation of Prime-Age Workers.”
The Child Care Sector: An Overview
Despite its downstream significance on parents’ participation in the labor market, the child care industry’s immediate imprint on the U.S. economy is small. In 2019, the gross output from child day care services was $63.8 billion—0.3% of gross domestic product (GDP) that year.Gross output includes both final and intermediate sales; since intermediate sales are excluded from total GDP, this comparison can be considered an “upper bound” estimate of size in GDP terms. It employed 920,000 people, 0.6% of all workers. These fractions have shrunk in the wake of the pandemic, as service sector jobs with a high degree of in-person contact have been disproportionately impacted by the pandemic.
Child Care Employment since January 2017
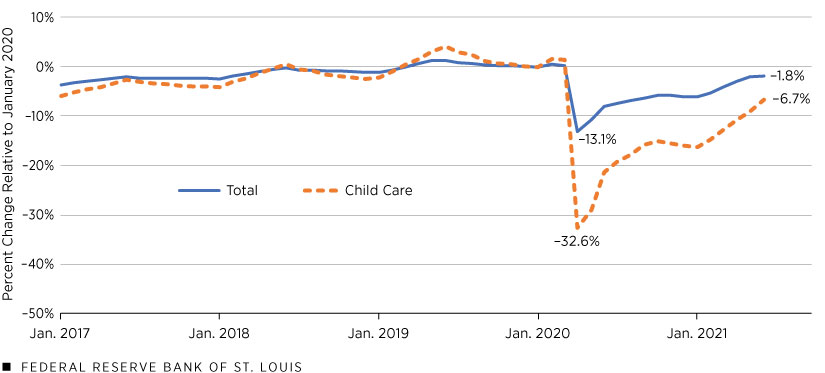
SOURCES: Bureau of Labor Statistics (BLS), Haver Analytics and authors’ calculations.
The figure above shows the trends in total and child care employment relative to January 2020. Between January and April 2020, employment in the child care sector declined by 33%, almost three times the national average of overall employment. This decline is particularly troubling because the sector employs many of the most economically vulnerable members of society, and the statistic signifies a sharp decline in the sector’s capacity to provide services to families.
Worker Wages and Consumer Costs
Despite—or, perhaps, because of—the importance of labor in the child care industry, child care workers earn significantly less than the average worker. In 2019, the average child care center worker wage was $13.72 per hour—while the average wage across all occupations was $25.72 per hour.Median wages—sometimes preferred as a measure of typical workers because they are less affected by extremely high-wage outliers—show a similar story: The median child care wage was $12.80, whereas the median wage across all industries was $19.14. This discrepancy may be due in part to differences in worker training and requirements; the share of child care workers with a college degree is relatively lower than that for all workers (27% versus 36%, respectively). There is also likely significant pressure to keep wages low and care affordable since the industry is labor-intensive.As a comparison, the U.S. Department of Education reports that salaries and employee benefits at public elementary and secondary schools in 2017-18 accounted for 56% and 24% of expenditures, respectively.
For those readers paying for child care, these low wages might come as a surprise, given how expensive child care is from the customer’s perspective. Using wage data and some basic assumptions about the industry, one can see how a low-wage sector can produce a high-cost service. Our estimates indicate that the average cost of child care, using 2019 wage data, was approximately $9,000 per year.This estimate is similar to other estimates; for example, a 2009 BLS report found that families with both parents working spent $6,864 on child care in 2009, which is $8,940 in 2019 after adjusting for child care inflation. The nonprofit ChildCare Aware of America calculated families spent $9,200 to $9,600 per child on child care in 2019. See “Picking Up the Pieces: Building a Better Child Care System Post COVID-19,” ChildCare Aware of America. (Appendix tables summarize this cost calculation.) While staff wages are the primary driver of overall costs, child-to-teacher ratios—which increase with child age—are the key driver of cost differences between age groups; we estimate that the cost of providing care for an infant is twice that of providing care for a preschool-age child.
Economic Decision Facing Working Parents
Based on our calculation, child care costs about 14% of median household income. The relatively high cost of child care (or the lack of affordable child care) is often cited as a factor keeping parents (or grandparents) out of the labor force; a couple may decide it is more affordable for one member to stay home and provide child care. Such a decision can affect the stay-at-home parent’s lifetime earnings beyond the immediate forfeited income, since individuals out of the labor force for long periods can find it difficult to maintain and build the job skills necessary to reenter the labor force and receive salaries equivalent to what they would have been, had they not left.
Because women tend to assume these caregiving responsibilities, this decision is one factor contributing to the gender pay gap.For more information, see “Gender Wage Gap May Be Much Smaller Than Most Think,” St. Louis Fed.
A Closer Look at the Eighth District
Economic data on the child care industry in the Eighth District states reflect many of the national dynamics resulting from the pandemic. The industry experienced steep employment losses during the initial months of the pandemic, followed by an ongoing, incomplete recovery. Most District states fared slightly better than the national average during the initial shutdown—with the notable exception of Kentucky, which saw employment of child care workers drop by over half.Because of data limitations here and elsewhere, we analyze statewide data despite the Eighth Federal Reserve District containing only a portion of several states. Child care employment in the District has recovered faster than the national average, with Arkansas and Mississippi more than fully recovered, but other states still face considerable shortfalls.
Wages in the District’s child care sector vary considerably across states; given the relatively low wages for these workers, it is likely that differences in state minimum wages are influencing and will continue to influence the rate of growth and these differentials. In many District states, child care workers earn about half the average wage for all occupations. While these numbers may appear close at first glance, Kentucky has a much smaller gap (58.2%), almost 10 percentage points higher than Mississippi (48.5%).
| U.S. | Arkansas | Illinois | Indiana | Kentucky | Missouri | Mississippi | Tennessee | |
|---|---|---|---|---|---|---|---|---|
| Employment Relative to January 2020 (Percent Change) | ||||||||
| April 2020 | -32.6% | -24.0% | -25.8% | -25.7% | -54.6% | -24.8% | -21.2% | -20.9% |
| June 2021 | -6.7% | 3.2% | -5.1% | -3.4% | -1.3% | -3.7% | -5.5% | -0.5% |
| Child Care Worker Hourly Wages, 2019 | ||||||||
| Wage | $13.72 | $10.63 | $13.28 | $11.64 | $12.31 | $12.24 | $9.34 | $10.93 |
| Relative to Overall Average Wages | 53.3% | 51.8% | 50.1% | 51.8% | 58.2% | 53.2% | 48.5% | 49.8% |
| SOURCES: BLS Quarterly Census of Employment and Wages, BLS Occupational Employment Statistics and authors’ calculations. | ||||||||
Child Care Industry Outlook
Data from the Bureau of Labor Statistics also show that the cost of child care has been rising much faster than overall prices. Since 2000, the consumer price index (CPI) has increased at an average annual rate of 2.3%, whereas the CPI for day care and preschool has increased an at average annual rate of 3.9%. Surprisingly, hourly earnings growth of child care workers has increased at about the same rate as that for other nonsupervisory employees—around 2.9%. Because the price of child care has increased faster than wages, it’s likely other demand-side factors may be leading faster price growth for child care services. For example, more households with two people working full-time and higher-educated and higher-income families are now more likely to have children. Compounding these historical pressures, the COVID-19 pandemic has led to sudden wage growth for child care workers and centers looking to rebuild lost capacity and retain workers. As of October 2021, average hourly earnings for child care workers had risen to $16.44, up 10.4% from one year ago—on top of already above-average wage growth of 4.3% between September 2019 and September 2020, and much stronger than the 5.8% wage growth for all nonsupervisory employees over the same period.
Lasting Impact from the Pandemic?
These pandemic effects on the sector might linger for some time. As the labor market recovers and parents seek ways to get back to work, a decline in child care capacity, combined with higher wages, could continue to push up the cost of care in the short run. Expanded federal aid to families may ease the burden of child care costs, but more income for families with children could just increase demand—and thus, to some extent, prices—until supply catches up.
Expanded parental leave policies by the private sector and some states could reduce the demand for infant care, the most expensive type of care for centers to provide. Remote work could also provide some flexibility to parents seeking more-informal or mixed child care arrangements, but working from home while also providing child care is far from an ideal long-term solution for many households. Expanded universal pre-K programs are also being considered to ease the financial burden on families. On one hand, expanded pre-K enrollment in child care centers could offset some high-cost infant care; on the other hand, competition from elementary schools could reduce pre-K enrollment at child care centers and increase the cost of providing care to infants and toddlers.For instance, see Jessica H. Brown’s 2019 working paper (PDF). This is a particular concern if elementary schools begin to offer preschool care but not infant or toddler care; existing day care providers frequently use the former to subsidize the latter, since the infant care is more labor-intensive (and, thus, costly). If day care centers are excluded from universal pre-K or have to compete with elementary schools for preschoolers, they would likely have to raise prices on infant or toddler care as a consequence. Here, policy specifics matter significantly. If most existing child care centers are allowed to receive universal pre-K funds or the programs are designed to complement existing child care providers, the substitution or competition effect may be small enough to not counteract a general increase in demand from families. However, looser inclusion requirements for universal pre-K to include nonlicensed child care providers could run into other issues.
While much remains uncertain about the future of the child care industry, policy suggestions like these are important to consider as the industry—unassuming and important as it is—continues to change with the pandemic and population demographics.
The Economic Impact of Child Care by State
Get child care data for all 50 states, including:
- child care affordability estimates
- data on the percentage of single parents
- labor force participation rates
- statistics about workforce-related struggles facing child care providers
Fact sheets prepared by Federal Reserve Bank of St. Louis researchers.
Appendix
| (1) | Average Hourly Child Care Worker Wage | $13.72 |
| (2) | Payroll Costs/Benefits (25% of wages) | $3.43 |
| (3) | Equals: Hourly Labor Cost (lines 1 + 2) | $17.15 |
| (4) | Hours per Day | 8 |
| (5) | Days per Month | 20 |
| (6) | Equals: Monthly Labor Cost (lines 3 x 4 x 5) | $2,744 |
| (7) Teacher: Child Ratio |
(8) Monthly Labor Cost per Child (line 6 x column 7) |
(9) Annual Labor Cost per Child (column 8 x 12 months) |
(10) Labor Share of Total Expenses |
(11) Equals: Total Cost per Child (column 9 x 1/column 10) |
|
|---|---|---|---|---|---|
| Infant | 1:4 | $686 | $8,232 | 68% | $12,106 |
| Toddler | 1:6 | $457 | $5,484 | 62% | $8,845 |
| Preschool | 1:10 | $274 | $3,288 | 56% | $5,871 |
| Average | $473 | $5,668 | 62% | $9,142 | |
| NOTES: Authors assume employer payroll costs and benefits equal 25% of wages. This is calculated using the ratio of wages and salaries and total compensation from the BLS Employer Costs for Employee Compensation for 10th wage percentile workers. Operating hours are assumed at eight hours a day and 20 business days per month. No overtime labor hours are assumed. Teacher-to-child ratios are from NAEYC.org (PDF), and labor share of child care expenses is from the U.S. Treasury September 2021 report (PDF). | |||||
Endnotes
- While not discussed in this essay, the caregiving economy would also include elder care at nursing homes or in-home care, which has a similar economic structure and faces similar challenges as the child care industry.
- Sources: Census Bureau, IPUMS, authors’ calculations. This includes 9.7 million parents whose spouses work full-time (7.6% of full-time workers) and 2.3 million full-time single parents (1.8% of full-time workers).
- Source: Center for American Progress. The center, analyzing U.S. census data, found that 47% of children under 5 spend time in licensed child care and 24% spend time in unlicensed nonrelative care.
- See, for example, the On the Economy blog posts “COVID-19 and the Great Recession: Market Hours and Home Production across American Households” and “Family Needs Affect U.S. Labor Participation of Prime-Age Workers.”
- Gross output includes both final and intermediate sales; since intermediate sales are excluded from total GDP, this comparison can be considered an “upper bound” estimate of size in GDP terms.
- Median wages—sometimes preferred as a measure of typical workers because they are less affected by extremely high-wage outliers—show a similar story: The median child care wage was $12.80, whereas the median wage across all industries was $19.14.
- As a comparison, the U.S. Department of Education reports that salaries and employee benefits at public elementary and secondary schools in 2017-18 accounted for 56% and 24% of expenditures, respectively.
- This estimate is similar to other estimates; for example, a 2009 BLS report found that families with both parents working spent $6,864 on child care in 2009, which is $8,940 in 2019 after adjusting for child care inflation. The nonprofit ChildCare Aware of America calculated families spent $9,200 to $9,600 per child on child care in 2019. See “Picking Up the Pieces: Building a Better Child Care System Post COVID-19,” ChildCare Aware of America.
- For more information, see “Gender Wage Gap May Be Much Smaller Than Most Think,” St. Louis Fed.
- Because of data limitations here and elsewhere, we analyze statewide data despite the Eighth Federal Reserve District containing only a portion of several states.
- For instance, see Jessica H. Brown’s 2019 working paper (PDF). This is a particular concern if elementary schools begin to offer preschool care but not infant or toddler care; existing day care providers frequently use the former to subsidize the latter, since the infant care is more labor-intensive (and, thus, costly). If day care centers are excluded from universal pre-K or have to compete with elementary schools for preschoolers, they would likely have to raise prices on infant or toddler care as a consequence. Here, policy specifics matter significantly. If most existing child care centers are allowed to receive universal pre-K funds or the programs are designed to complement existing child care providers, the substitution or competition effect may be small enough to not counteract a general increase in demand from families. However, looser inclusion requirements for universal pre-K to include nonlicensed child care providers could run into other issues.


Views expressed in Regional Economist are not necessarily those of the St. Louis Fed or Federal Reserve System.
For the latest insights from our economists and other St. Louis Fed experts, visit On the Economy and subscribe.
Email Us