COVID-19 and the Great Recession: Market Hours and Home Production across American Households
In this post, we examine what type of individuals were hit the hardest by the ongoing economic shutdown, categorizing individuals according to gender, education level, marital status, spouse’s employment status Due to the small number of married women with non-employed spouses, we only distinguish based on spouse employment for men. and presence of children in the home. We found an important difference in the impact experienced by these groups in terms of both their loss of market hours (hours of paid work) and the consequent gain in home production hours. “Home production” here includes such categories as home improvement projects, cooking dinners and child care. We then compared and contrasted these ongoing effects with what ensued as a result of the Great Recession (2007-2009).
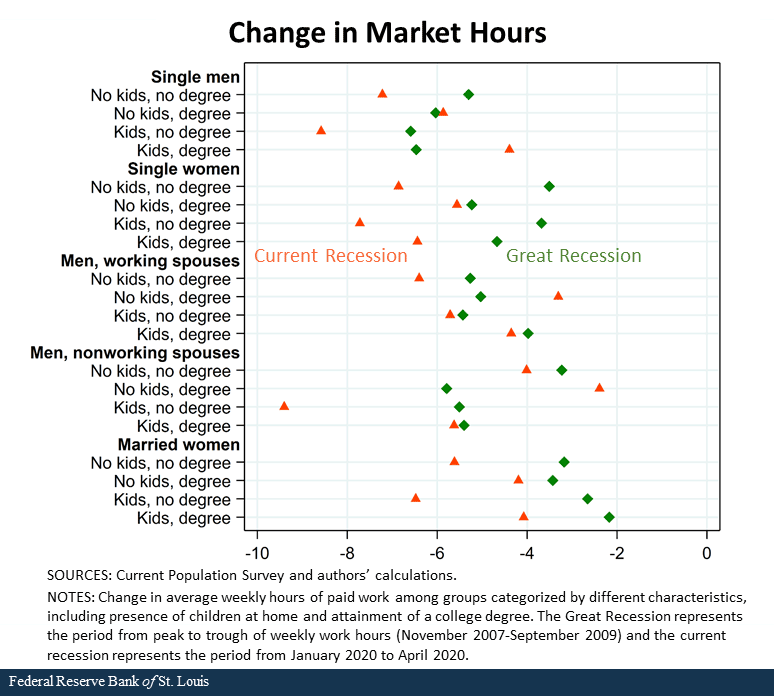
We employed the monthly Current Population Survey to calculate average weekly work hours among working age people in each group. Because work hours began to pick up in May, we focused on the drop in hours between January* and April. To draw parallels between the two recent recessions, we also calculated the drop in market hours between November 2007, the month before the Great Recession officially began, and September 2009, the month that marked the lowest point for average hours. See the figure below.

The figure reveals several interesting differences. It is well known that men always fare worse than women during recessions, as male-dominated sectors tend to be more affected by down-turns. See, for example, the Regional Economist article “The ‘Man-Cession” of 2008-2009: It’s Big, but It’s Not Great” from October 2009. Because of the Great Recession, for example, men lost almost twice as many weekly hours as women (5.45 versus 3.26).
The recent recession, however, marked similar losses across genders—6.51 hours for men and 5.87 hours for women. This is because the downturn featured a larger negative impact on female-dominated service sectors and increased childcare needs due to school and daycare closures. It is similarly unsurprising that households with children lost more hours in the current recession than those without (6.27 vs. 6.18), while the opposite was true from 2007 to 2009 (4.05 versus 4.53).
Finally, we observe that college-educated individuals lost significantly fewer hours in the current recession than their less-educated counterparts (4.89 versus 7.02), whereas both groups lost about the same number of hours because of the Great Recession (4.42 versus 4.36). This is no doubt because college-educated individuals are more likely to have jobs that can be performed from home. See, for example, the June article “The Unequal Impact of COVID-19: Why Education Matters” from the Federal Reserve Bank of San Francisco.
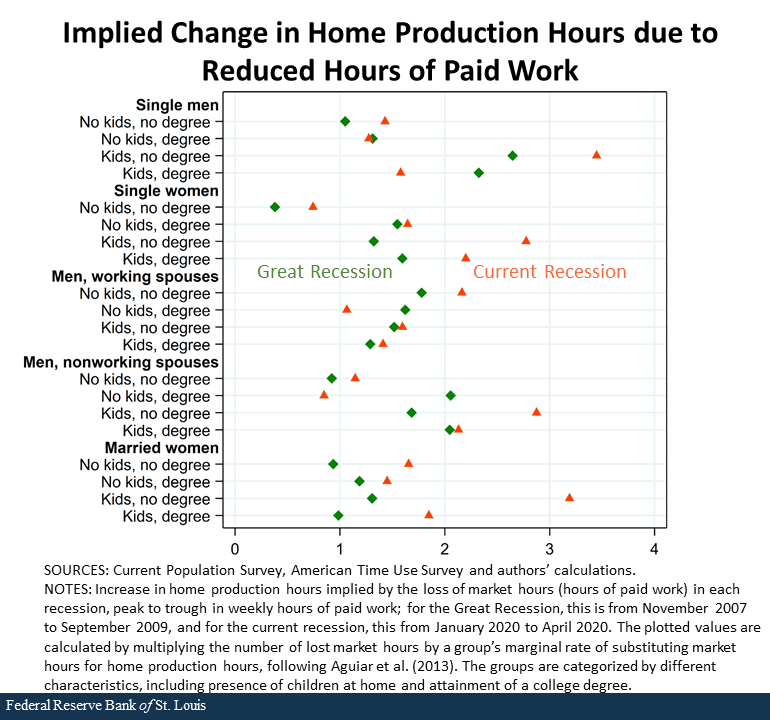
To calculate the change in average hours of home production implied by these market hour losses, we used American Time Use Survey (ATUS) data to calculate a given group’s marginal rate of substitution—following the methodology of the 2013 work done by Mark Aguiar and other economists—and multiplied this marginal rate by their average market hours lost. ATUS data are available through 2018, so we could also calculate the actual change in home production hours between the Great Recession’s peak and trough. However, the ATUS data suffers from small sample sizes and exhibits clear time trends, which could potentially override the effect we are interested in: the increase in home production hours that is directly caused by the loss of market hours during the recession. See the figure below.

A few interesting patterns emerge. In the current recession, the two groups predicted to increase their hours the most—less-educated single men with children and less-educated married women with children—do so for very different reasons: the former because they lost more market hours than almost any other group and the latter because they substituted home production for lost work more than any other group.
Unsurprisingly, parents increased home production more than those without children at home in both recessions but especially so in the current recession. This is due to the differential labor market impact discussed above.
Meanwhile, while single individuals’ market hours were much more affected by both recessions when compared with those of married individuals, they did not increase home production more, due to their low substitution rates.
*Editor's Note: This article was updated to correct the time period covered by the study.
Notes and References
1 Due to the small number of married women with non-employed spouses, we only distinguish based on spouse employment for men.
2 “Home production” here includes such categories as home improvement projects, cooking dinners and child care.
3 See, for example, the Regional Economist article “The ‘Man-Cession” of 2008-2009: It’s Big, but It’s Not Great” from October 2009.
4 See, for example, the June article “The Unequal Impact of COVID-19: Why Education Matters” from the Federal Reserve Bank of San Francisco.
5 ATUS data are available through 2018, so we could also calculate the actual change in home production hours between the Great Recession’s peak and trough. However, the ATUS data suffers from small sample sizes and exhibits clear time trends, which could potentially override the effect we are interested in: the increase in home production hours that is directly caused by the loss of market hours during the recession.
Additional Resources
- St. Louis Fed’s COVID-19 resource page
- On the Economy: Reading the Labor Market in Real Time
- On the Economy: COVID-19, School Closings and Labor Market Impacts
Citation
Oksana Leukhina, Devin Werner and Zhixiu Yu, ldquoCOVID-19 and the Great Recession: Market Hours and Home Production across American Households,rdquo St. Louis Fed On the Economy, July 14, 2020.
This blog offers commentary, analysis and data from our economists and experts. Views expressed are not necessarily those of the St. Louis Fed or Federal Reserve System.
Email Us
All other blog-related questions


