


Recession Signals: Housing Indicators Remain Consistent With a Broader Slowdown in 2020
KEY TAKEAWAYS
- Over the past year, four housing indicators have moved in ways consistent with patterns seen before three previous recessions.
- These indicators are mortgage rates, existing home sales, real house prices and the momentum of residential investment.
- More recent housing data still point to a slowdown, albeit a less severe one.
A year ago I noted that recent movements in four key housing indicators—mortgage rates, existing home sales, real house prices and the momentum of residential investment—
One year later, three of these housing indicators have changed very little, while one—the 30-year mortgage rate—has dropped significantly. Still, all four indicators remain consistent with a recession beginning in late 2019 or early 2020 based on their behaviors in previous business cycles.
Year-Ago Outlook Holds with Latest Data
The most important insight provided by four additional quarters of data is that the current business cycle appears more similar to the periods before the relatively mild 1990-91 and 2001 recessions than the very severe 2007-09 Great Recession, at least in terms of housing indicators. There is little evidence from the more recent data that recession risks have disappeared.
In the following sections, I update the four housing indicators through the third quarter of 2019 to gauge the signals they may be sending about a potential near-term recession.
1. 30-Year Fixed Mortgage Rates
Consistent with earlier cycles, the average 30-year fixed mortgage rate has declined significantly even though a recession has not begun. Figure 1 updates the path of this long-term mortgage rate through the third quarter of 2019.The placement of the respective housing indicator in this and all subsequent figures assumes that a recession will begin in the fourth quarter of 2019, even though the beginning date of any future recession is unknown. I make this assumption simply to place the current cycle in a plausible position relative to previous cycles. The last observation of about one-half of one percentage point below the most recent three-year moving average is identical to the level one quarter before the onset of the 2001 recession and is just below the level one quarter before the 1990-91 recession. Hence, this indicator remains consistent with—though still does not guarantee—an imminent recession.
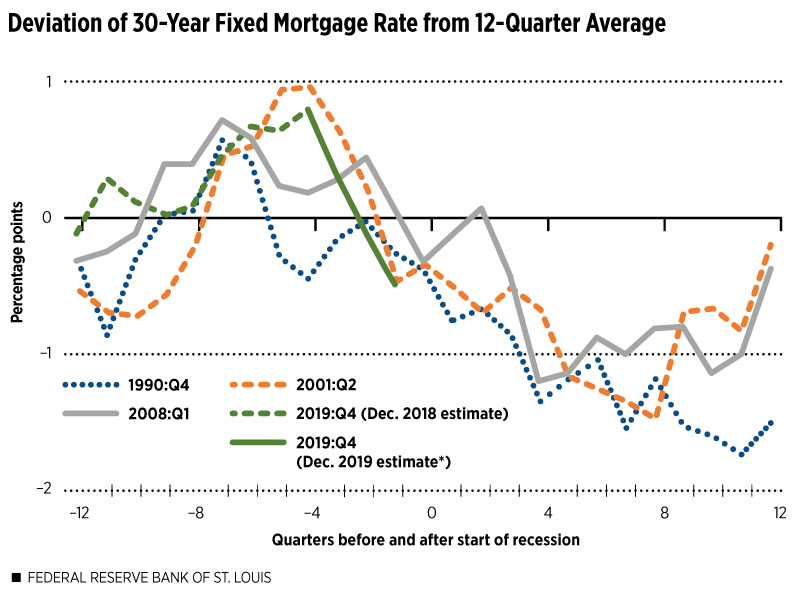
SOURCE: Freddie Mac.
NOTES: The figure shows the average quarterly 30-year fixed mortgage rate minus the average of the previous three years (12 quarters). Each line shows three years of data before and after a recession; time zero is the quarter in which a recession began. The first quarter of the recession is indicated in the line label (key): the fourth quarter of 1990, second quarter of 2001 and first quarter of 2008.
*This line assigns the beginning of the next recession (period zero) to the fourth quarter of 2019; of course, the onset of the next recession is unknown. The last observation in this series (for quarter -1) is for the third quarter of 2019.
2. Existing Home Sales
The pace of existing home sales relative to their recent trend rate continued to slow during 2019. (See Figure 2.) Despite a modest upturn in the third quarter of 2019, this indicator remains firmly in the range observed prior to the 1990-91 and 2001 recessions. In contrast to the Great Recession, the decline in home sales since dipping below zero has been much more moderate.
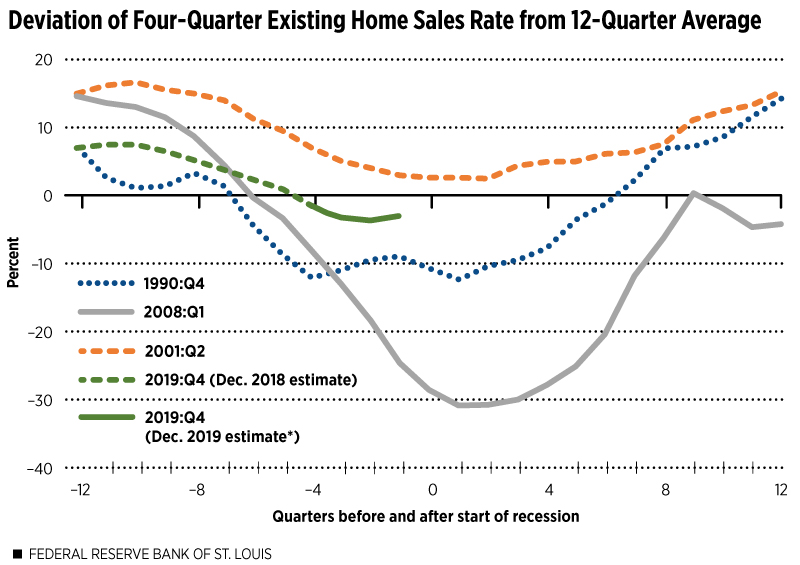
SOURCE: National Association of Realtors.
NOTES: The figure shows the percent difference between the current rate of existing single-family home sales (four-quarter average) and the average annualized sales rate during the previous three years (12 quarters). Each line shows three years of data before and after a recession; time zero is the quarter in which a recession began. The first quarter of the recession is indicated in the line label (key): the fourth quarter of 1990, second quarter of 2001 and first quarter of 2008.
*This line assigns the beginning of the next recession (period zero) to the fourth quarter of 2019; of course, the onset of the next recession is unknown. The last observation in this series (for quarter -1) is for the third quarter of 2019.
3. Real House Prices
Qualitatively, the recent behavior of inflation-adjusted home-price growth relative to its recent trend rate (shown in Figure 3) is very similar to the patterns of the two previous indicators—that is, it mirrors the run-up to the relatively mild 1990-91 and 2001 recessions and is unlike the pattern just before the Great Recession.
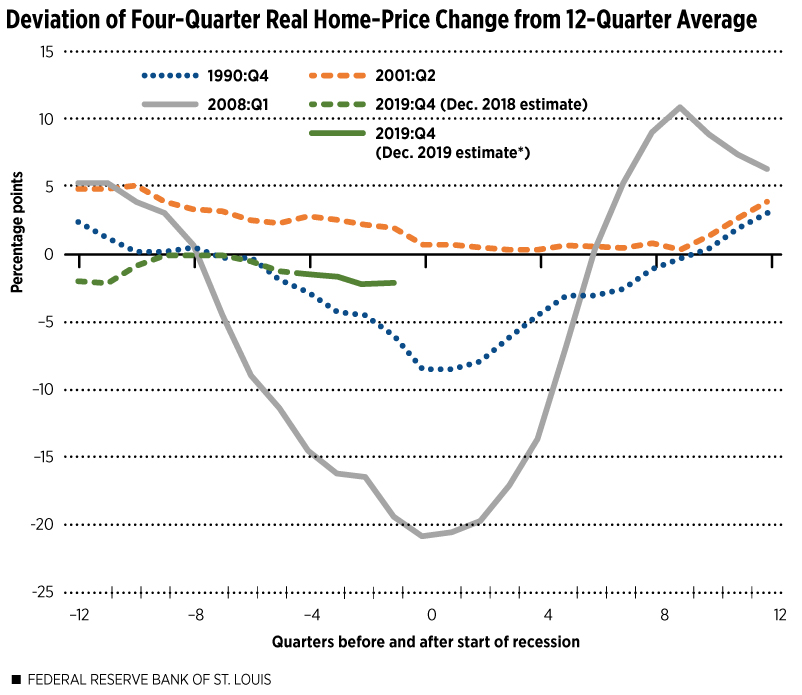
SOURCES: S&P CoreLogic and U.S. Bureau of Economic Analysis.
NOTES: The figure shows the four-quarter percent change in the CoreLogic Home Price Index, deflated by the Personal Consumption Expenditures (PCE) Chain-Weighted Price Index, minus the annualized percent change during the previous three years (12 quarters). Each line shows three years of data before and after a recession; time zero is the quarter in which a recession began. The first quarter of the recession is indicated in the line label (key): the fourth quarter of 1990, second quarter of 2001 and first quarter of 2008.
*This line assigns the beginning of the next recession (period zero) to the fourth quarter of 2019; of course, the onset of the next recession is unknown. The last observation in this series (for quarter -1) is for the third quarter of 2019.
4. Contribution of Residential Investment to GDP Growth
If any of the highlighted housing indicators hints at a departure from the typical recessionary pattern it is the contribution of residential investment to GDP growth. (See Figure 4.) Despite some improvement over the course of 2019, residential investment continued to be a drag on economic growth through the third quarter, albeit a slightly smaller one than before. Of all four indicators, this one most closely resembles the patterns seen before the two relatively mild recessions of 1990-91 and 2001 versus the more severe Great Recession.
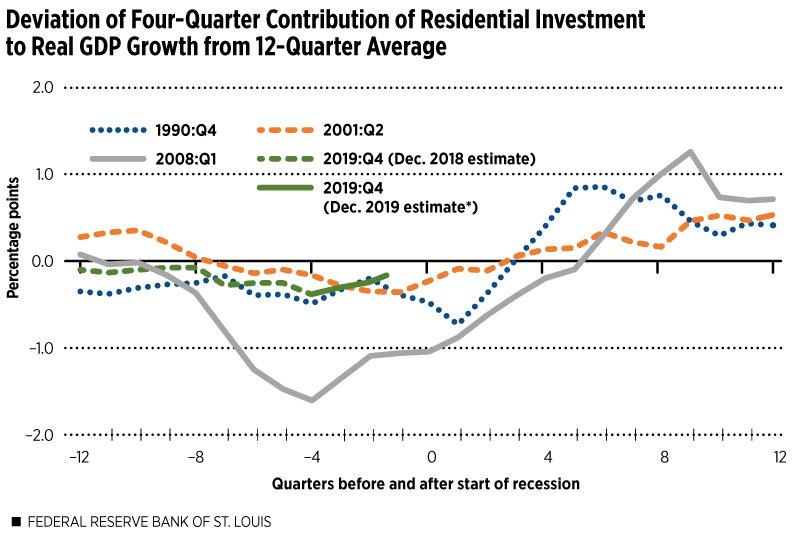
SOURCE: U.S. Bureau of Economic Analysis.
NOTES: The figure shows the four-quarter average contribution to real GDP growth minus the annualized contribution during the previous three years (12 quarters). Each line shows three years of data before and after a recession; time zero is the quarter in which a recession began. The first quarter of the recession is indicated in the line label (key): the fourth quarter of 1990, second quarter of 2001 and first quarter of 2008.
*This line assigns the beginning of the next recession (period zero) to the fourth quarter of 2019; of course, the onset of the next recession is unknown. The last observation in this series (for quarter -1) is for the third quarter of 2019.
Conclusion: Housing Indicators Still Signal Recession, Albeit a Less Severe One
The value of leading indicators—from housing variables to the slope of the yield curve—is that they offer an opportunity to prepare for a possible economic slowdown or outright downturn. A recent example is the Federal Reserve’s dramatic turn from a program of monetary tightening in 2018 to an easing of policy in 2019.
One hazard of leading indicators is that they can lead to misinterpretation and complacency. If the economic slowdown signaled by weakening housing indicators and some portions of the U.S. Treasury yield curve inverting in 2019 does not begin immediately, some observers may think the precautions undertaken in response to the signals, such as the Fed’s recent easing of monetary policy, can void the signals themselves and pre-empt a recession.
This would run counter to the historical patterns documented in this article: The Fed eased monetary policy and mortgage rates plunged in advance of each of the three previous recessions, yet the economy still went into a downturn. Thus, the value of leading indicators may lie more in their role as early warning signals that help us better prepare for, rather than outright prevent, a recession.
This time could be different, however, if the Fed’s timely interest rate cuts and other factors in fact help to prevent a recession in late 2019 or 2020. If that happens, we should re-examine the indicators that have been successful in signaling recessions in the past. In the meantime, we should not dismiss their salience.
Endnotes
- See Emmons, William R. “Recession Signals: Four Housing Indicators to Watch in 2019.” Housing Market Perspectives, December 2018.
- The placement of the respective housing indicator in this and all subsequent figures assumes that a recession will begin in the fourth quarter of 2019, even though the beginning date of any future recession is unknown. I make this assumption simply to place the current cycle in a plausible position relative to previous cycles.
This article originally appeared in our Housing Market Perspectives publication.

Citation
William R. Emmons, ldquoRecession Signals: Housing Indicators Remain Consistent With a Broader Slowdown in 2020,rdquo St. Louis Fed On the Economy, Dec. 17, 2019.
This blog offers commentary, analysis and data from our economists and experts. Views expressed are not necessarily those of the St. Louis Fed or Federal Reserve System.
Email Us
All other blog-related questions