


The End Is in Sight for the U.S. Foreclosure Crisis
The extended period of historically elevated rates of extreme mortgage distress and defaults in the U.S. housing market, better known as “the foreclosure crisis,” has faded from view as the economy continues its slow recovery. A deeper look at mortgage performance data from the Mortgage Bankers Association suggests the crisis has ended in some states, while it is not quite over yet for the nation as a whole. However, the end is near. The condition of current mortgage borrowers considered as a group—nationwide or state by state—is once again comparable to the period just before the Great Recession and the onset of the foreclosure crisis.
As explained below, we identify the fourth quarter of 2007 as the beginning of the nationwide foreclosure crisis; we judge that it had not yet ended as of the third quarter of 2016. Based on current trends, we expect it should end in early 2017. This nearly 10-year nationwide foreclosure crisis will have been longer and deeper than anything we’ve seen since the Great Depression. As many as 10 million mortgage borrowers may have lost their homes.1
Some states and regions have experienced severe recessions and housing crises worse than the nation as a whole, while others have suffered less. The result is a wide range of foreclosure-crisis experiences. Among the seven states that make up the Eighth Federal Reserve District, we conclude that only Missouri and Tennessee have exited their foreclosure crises as of the third quarter of 2016 when judged by a national standard; Arkansas likely will follow soon. Meanwhile, Illinois, Indiana, Kentucky and Mississippi may be a year or more away from exiting. If we take into account long-standing differences in mortgage conditions across states, our conclusions are more favorable. Only Illinois has failed to return to its own pre-crisis level and, even there, the end of the foreclosure crisis appears imminent.
Using Data to Define the Start and End of the Foreclosure Crisis
We define the recent foreclosure crisis as the period during which the share of mortgages that are seriously delinquent (90 days or more past due) or in foreclosure in a particular state or nationwide was above the worst level experienced in recent memory (i.e., not including the Great Depression).2 To recognize secular changes in mortgage practices and performance—in particular, steadily rising levels of outstanding mortgage debt and a proliferation of new types of mortgages—we calculate a crisis threshold for the nation and for individual states as the combined rate of serious delinquency plus foreclosure inventory that first exceeds its own five-year moving average by an amount greater than any previously experienced in the data.
We define the end of a foreclosure crisis as the first quarter in which the combined rate drops below its initial crisis reading.
The Foreclosure Crisis at a National Level
Mortgage Bankers Association data show that the U.S. foreclosure crisis started in the fourth quarter of 2007, when the combined rate reached 2.81 percent, a level that exceeded its five-year moving average by 0.67 percentage points, more than any other previous level. Given that the combined rate stood at 3.2 percent in the third quarter of 2016, this suggests that the nationwide foreclosure crisis has not yet quite ended. However, based on the rate of decline in recent quarters, the data-defined end of the crisis on a national scale is likely to occur as soon as the first quarter of 2017. (See Table 1.) Indeed, comparable data from Lender Processing Services, as shown in the recently released Housing Market Conditions report from the St. Louis Fed, also suggest the foreclosure crisis is nearing its end.
The Foreclosure Crisis in the St. Louis Fed’s Eighth District
Figure 1 displays the share of mortgages that are seriously delinquent or in foreclosure in all seven Eighth District states for the period 1980 through 2016. To determine the duration of state-level foreclosure crises, we examine two thresholds: a nationwide benchmark and a threshold unique to each state.3
Table 1 provides beginning and ending dates for the foreclosure crisis nationwide and for Eighth District states using the nationwide benchmark. Table 2 provides dates when crisis thresholds for each state are determined independently.
Using the common nationwide benchmark of 2.81 percent established earlier, and assuming the share of mortgages that are seriously delinquent or in foreclosure applies to each state individually, this would indicate that four of the states that comprise the Eighth District entered their respective foreclosure crises during 2007-2008. These states were Arkansas, Illinois, Missouri and Tennessee. As of the third quarter of 2016, Missouri and Tennessee had exited their crises while Arkansas was likely to do so shortly, perhaps by the end of the fourth quarter. However, Illinois may not exit for another year or so.
Meanwhile, the three remaining Eighth District states—Indiana, Kentucky and Mississippi—experienced a much longer foreclosure crisis based on this benchmark. This calls into question whether it is an appropriate measure for determining the duration of crises at the state level. According to the nationwide benchmark, these three states entered their respective crises as early as 2001 or 2002, and they are unlikely to exit their crises for another year or more. Taken literally, these estimates would suggest that Indiana, Kentucky and Mississippi will have endured foreclosure crisis conditions for more than 15 years.
A more sensible definition of a state-level foreclosure crisis relies on data that reflect unique characteristics of each particular state.
Table 2 shows beginning and ending dates based on thresholds computed for each state. Using this approach, all Eighth District states entered their own foreclosure crises during 2008-2009, somewhat later than the nation as a whole. By the third quarter of 2016, six of the seven District states had exited their foreclosure crises, with Illinois likely to follow very soon. Thus, using each state’s own history, the foreclosure crises experienced in the Eighth District were somewhat shorter than for the nation as a whole. At the same time, a majority of District states experienced higher average rates of serious mortgage distress than the nation as a whole during recent decades, so non-crisis periods are by no means without financial pain for many District residents. For the entire 1979-2016 period, the average serious-delinquency-plus-foreclosure-inventory rate was 2.80 percent for the U.S. as a whole. The comparable rates were lower in Missouri (2.04 percent), Arkansas (2.49 percent) and Kentucky (2.52 percent), but higher in Tennessee (2.81 percent), Indiana (3.29 percent), Mississippi (3.42 percent) and Illinois (3.68 percent).
Table 1
Beginning and Ending Dates of Foreclosure Crisis: Nationwide Threshold
|
|
Beginning of foreclosure crisis according to nationwide threshold | Combined rate of 90+ day delinquencies plus foreclosure inventory at time of entry (%) | End of foreclosure crisis according to nationwide threshold | Actual Q3.2016 combined rate of 90+ day delinquencies plus foreclosure inventory (%) |
|---|---|---|---|---|
| United States | Q4.2007 | 2.81% | Q1.2017 (expected) | 3.20% |
| Arkansas | Q3.2008 | 2.82% | Q4.2016 (expected) | 3.04% |
| Illinois | Q3.2007 | 2.84% | Q3.2017 (expected) | 3.81% |
| Indiana | Q2.2001 | 2.82% | Q3.2017 (expected) | 3.62% |
| Kentucky | Q4.2002 | 3.00% | Q3.2017 (expected) | 3.39% |
| Mississippi | Q1.2001 | 2.99% | Q2.2018 (expected) | 4.27% |
| Missouri | Q2.2008 | 2.95% | Q4.2015 | 2.37% |
| Tennessee | Q3.2007 | 2.90% | Q3.2016 | 2.77% |
SOURCE: Mortgage Bankers Association and author's own calculations.
Table 2
Beginning and Ending Dates of Foreclosure Crisis: State Threshold
|
|
Beginning of foreclosure crisis according to own state’s threshold | Combined rate of 90+ day delinquencies plus foreclosure inventory at time of entry (%) | End of foreclosure crisis according to own state’s threshold | Actual Q3.2016 combined rate of 90+ day delinquencies plus foreclosure inventory (%) |
|---|---|---|---|---|
| United States | Q4.2007 | 2.81% | Q1.2017 (expected) | 3.20% |
| Arkansas | Q1.2009 | 3.49% | Q1.2016 | 3.04% |
| Illinois | Q1.2008 | 3.61% | Q4.2016 (expected) | 3.81% |
| Indiana | Q1.2009 | 6.80% | Q3.2013 | 3.62% |
| Kentucky | Q1.2009 | 4.70% | Q4.2014 | 3.39% |
| Mississippi* | Q1.2009 | 5.95% | Q4.2013 | 4.27% |
| Missouri | Q2.2008 | 2.75% | Q1.2016 | 2.37% |
| Tennessee | Q4.2008 | 4.05% | Q1.2015 | 2.77% |
SOURCE: Mortgage Bankers Association and author's own calculations.
*Mississippi delinquency rates were adjusted manually to eliminate the hurricane-related spike in 2005-07.
It Has Been a Long, Hard Slog
However it is defined, the mortgage foreclosure crisis will go down as one of the worst periods in our nation’s financial history. For the nation as a whole, the crisis will have lasted almost a decade—about as long as the Great Depression. For most states in the Eighth District, the slightly shorter duration of their foreclosure crises, when measured against their own data trends, has been offset by higher average rates of serious mortgage distress seen even in non-crisis periods.
The conclusion that the foreclosure crisis has been a long, miserable experience for many is unavoidable. And many Americans continue to suffer lasting financial, emotional and even physical pain as a result of their experiences during this time. However, a look at the data today shows that, at least, the end is in sight.
For another view that shows how housing market conditions have changed over the past few years, see the heat maps below that compare mortgage conditions in the Eighth District in the third quarter of 2016 vs. five years earlier, in the third quarter of 2011.
For a look how much has changed in recent years for the U.S. as a whole, and for each of the seven states that comprise the Eighth District, see the St. Louis Fed's latest Housing Market Conditions report.
Figure 2
Seriously Delinquent Mortgages in the Eighth Federal Reserve District
PANEL A: Third quarter of 2011
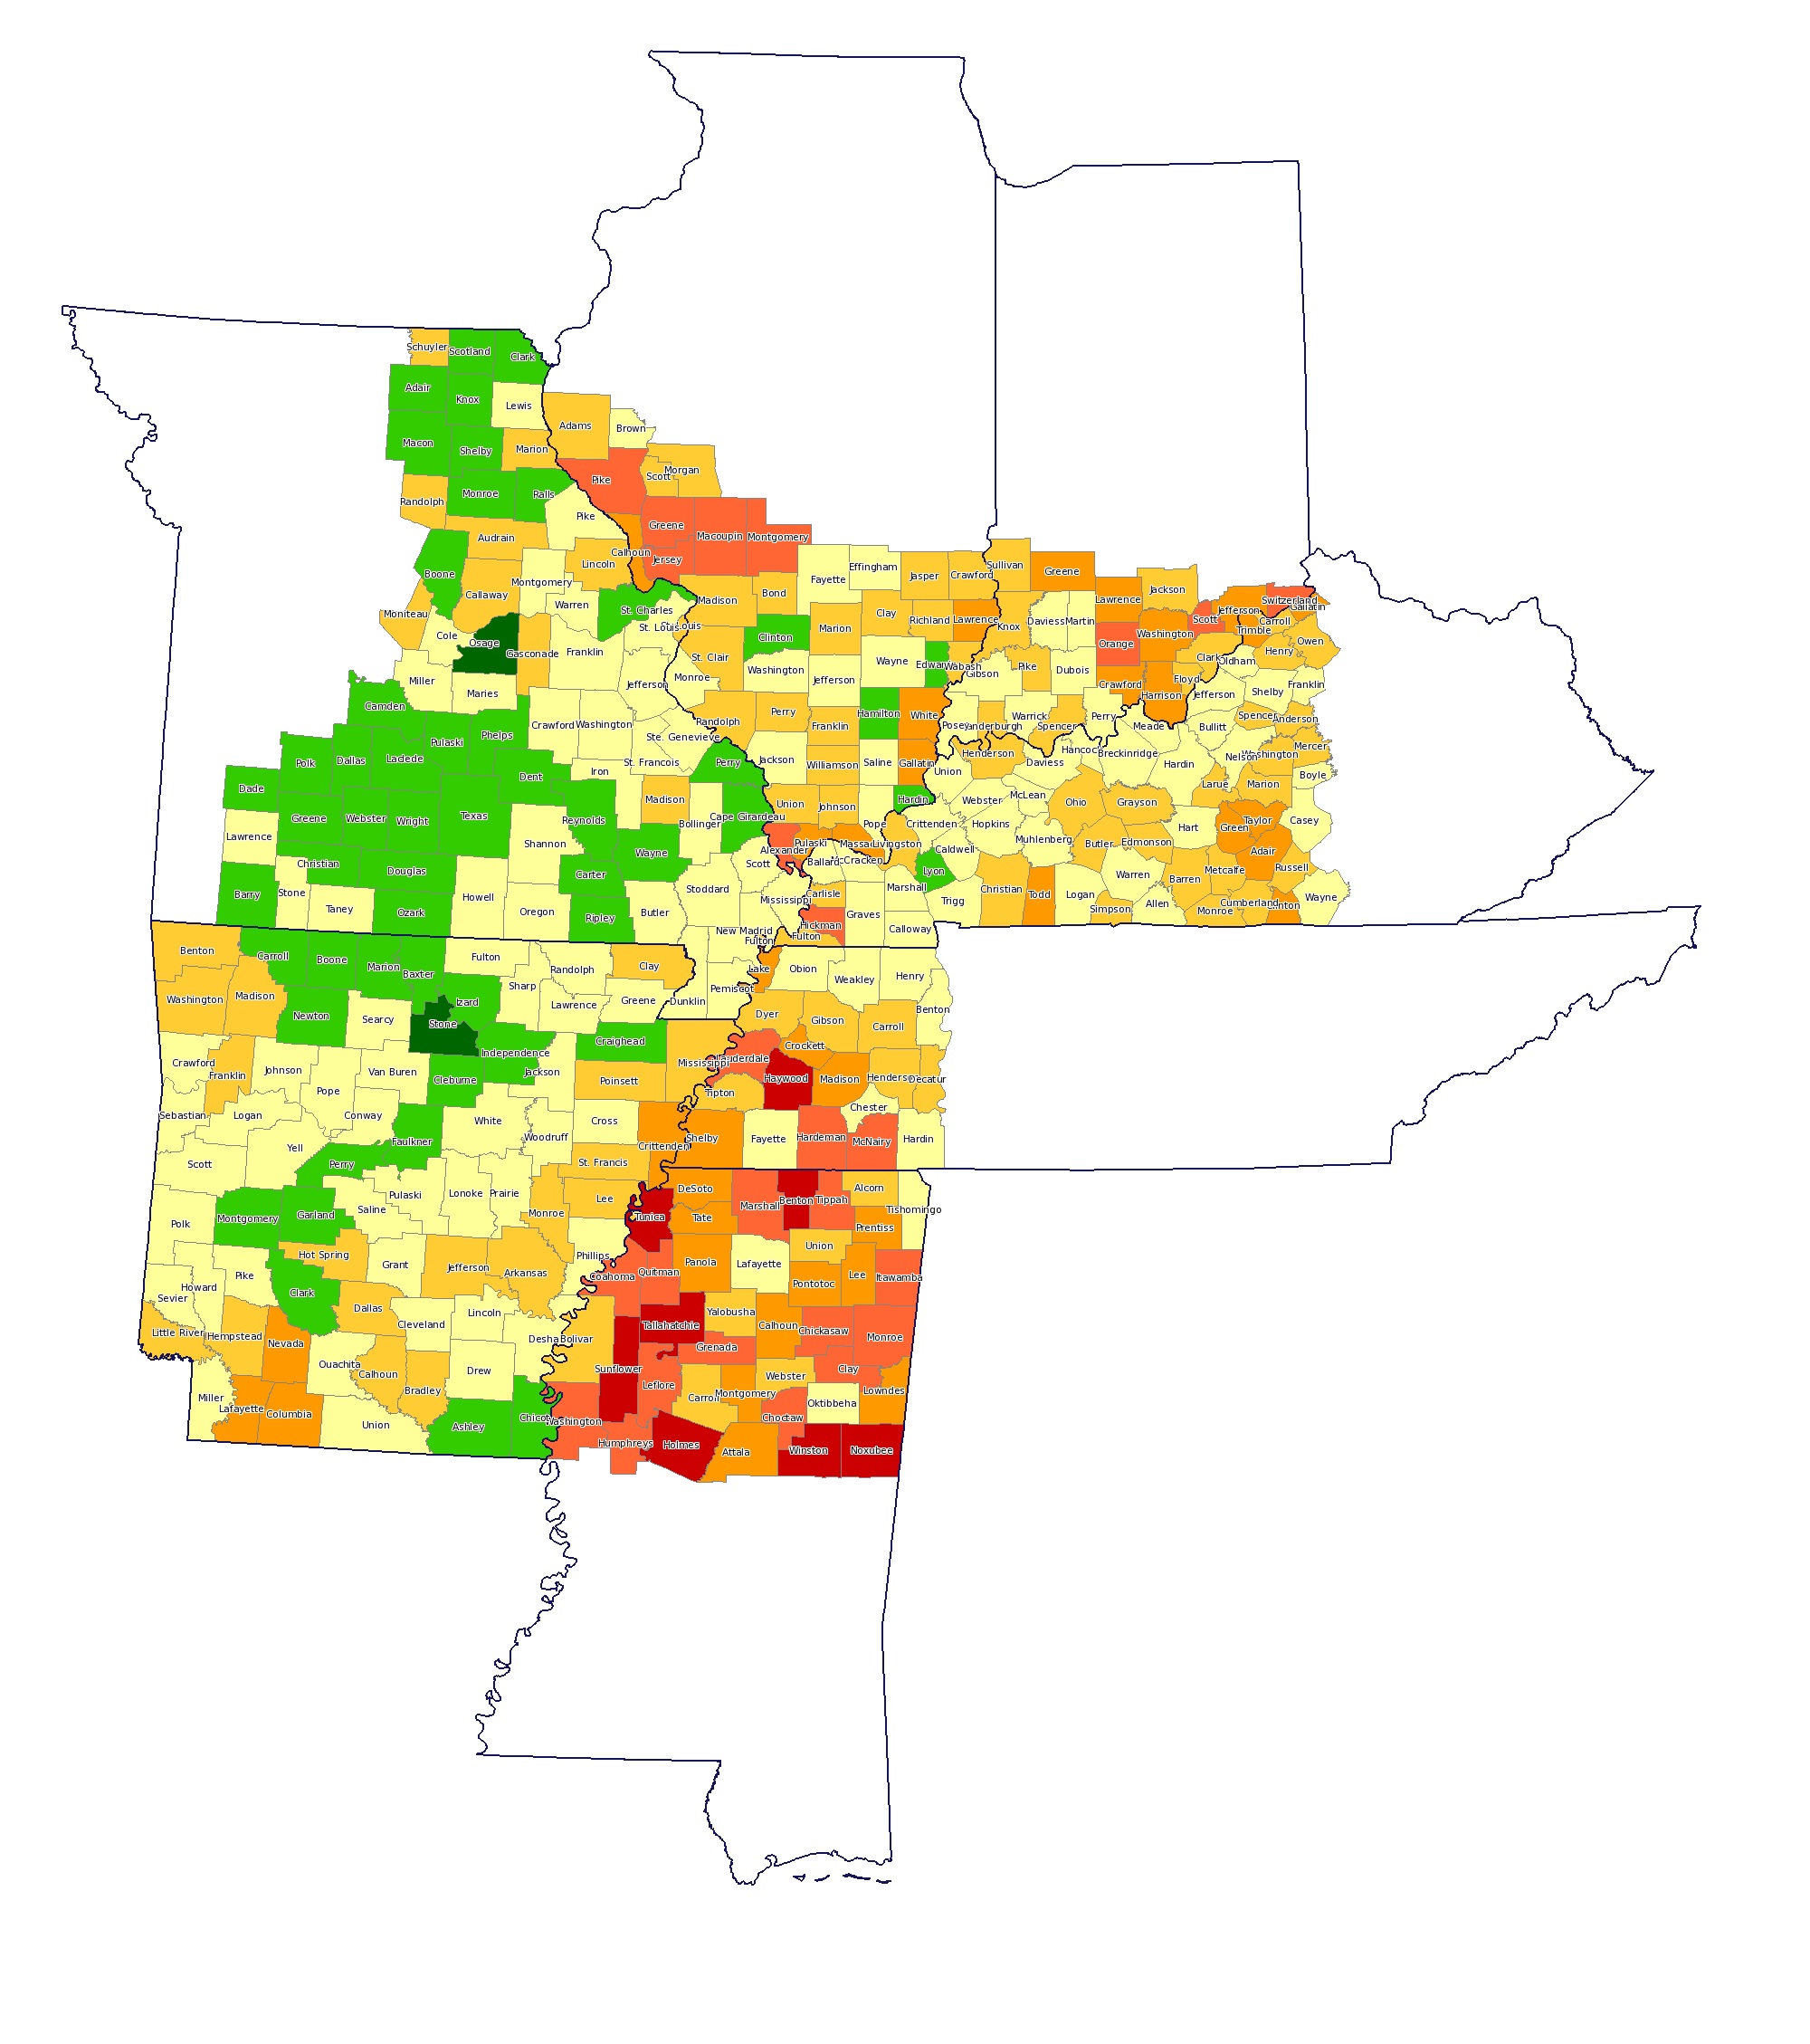
Source: Lender Processing Services
Map shows the share of mortgages in each county that were at least 90 days past due or in foreclosure.
PANEL B: Third quarter of 2016
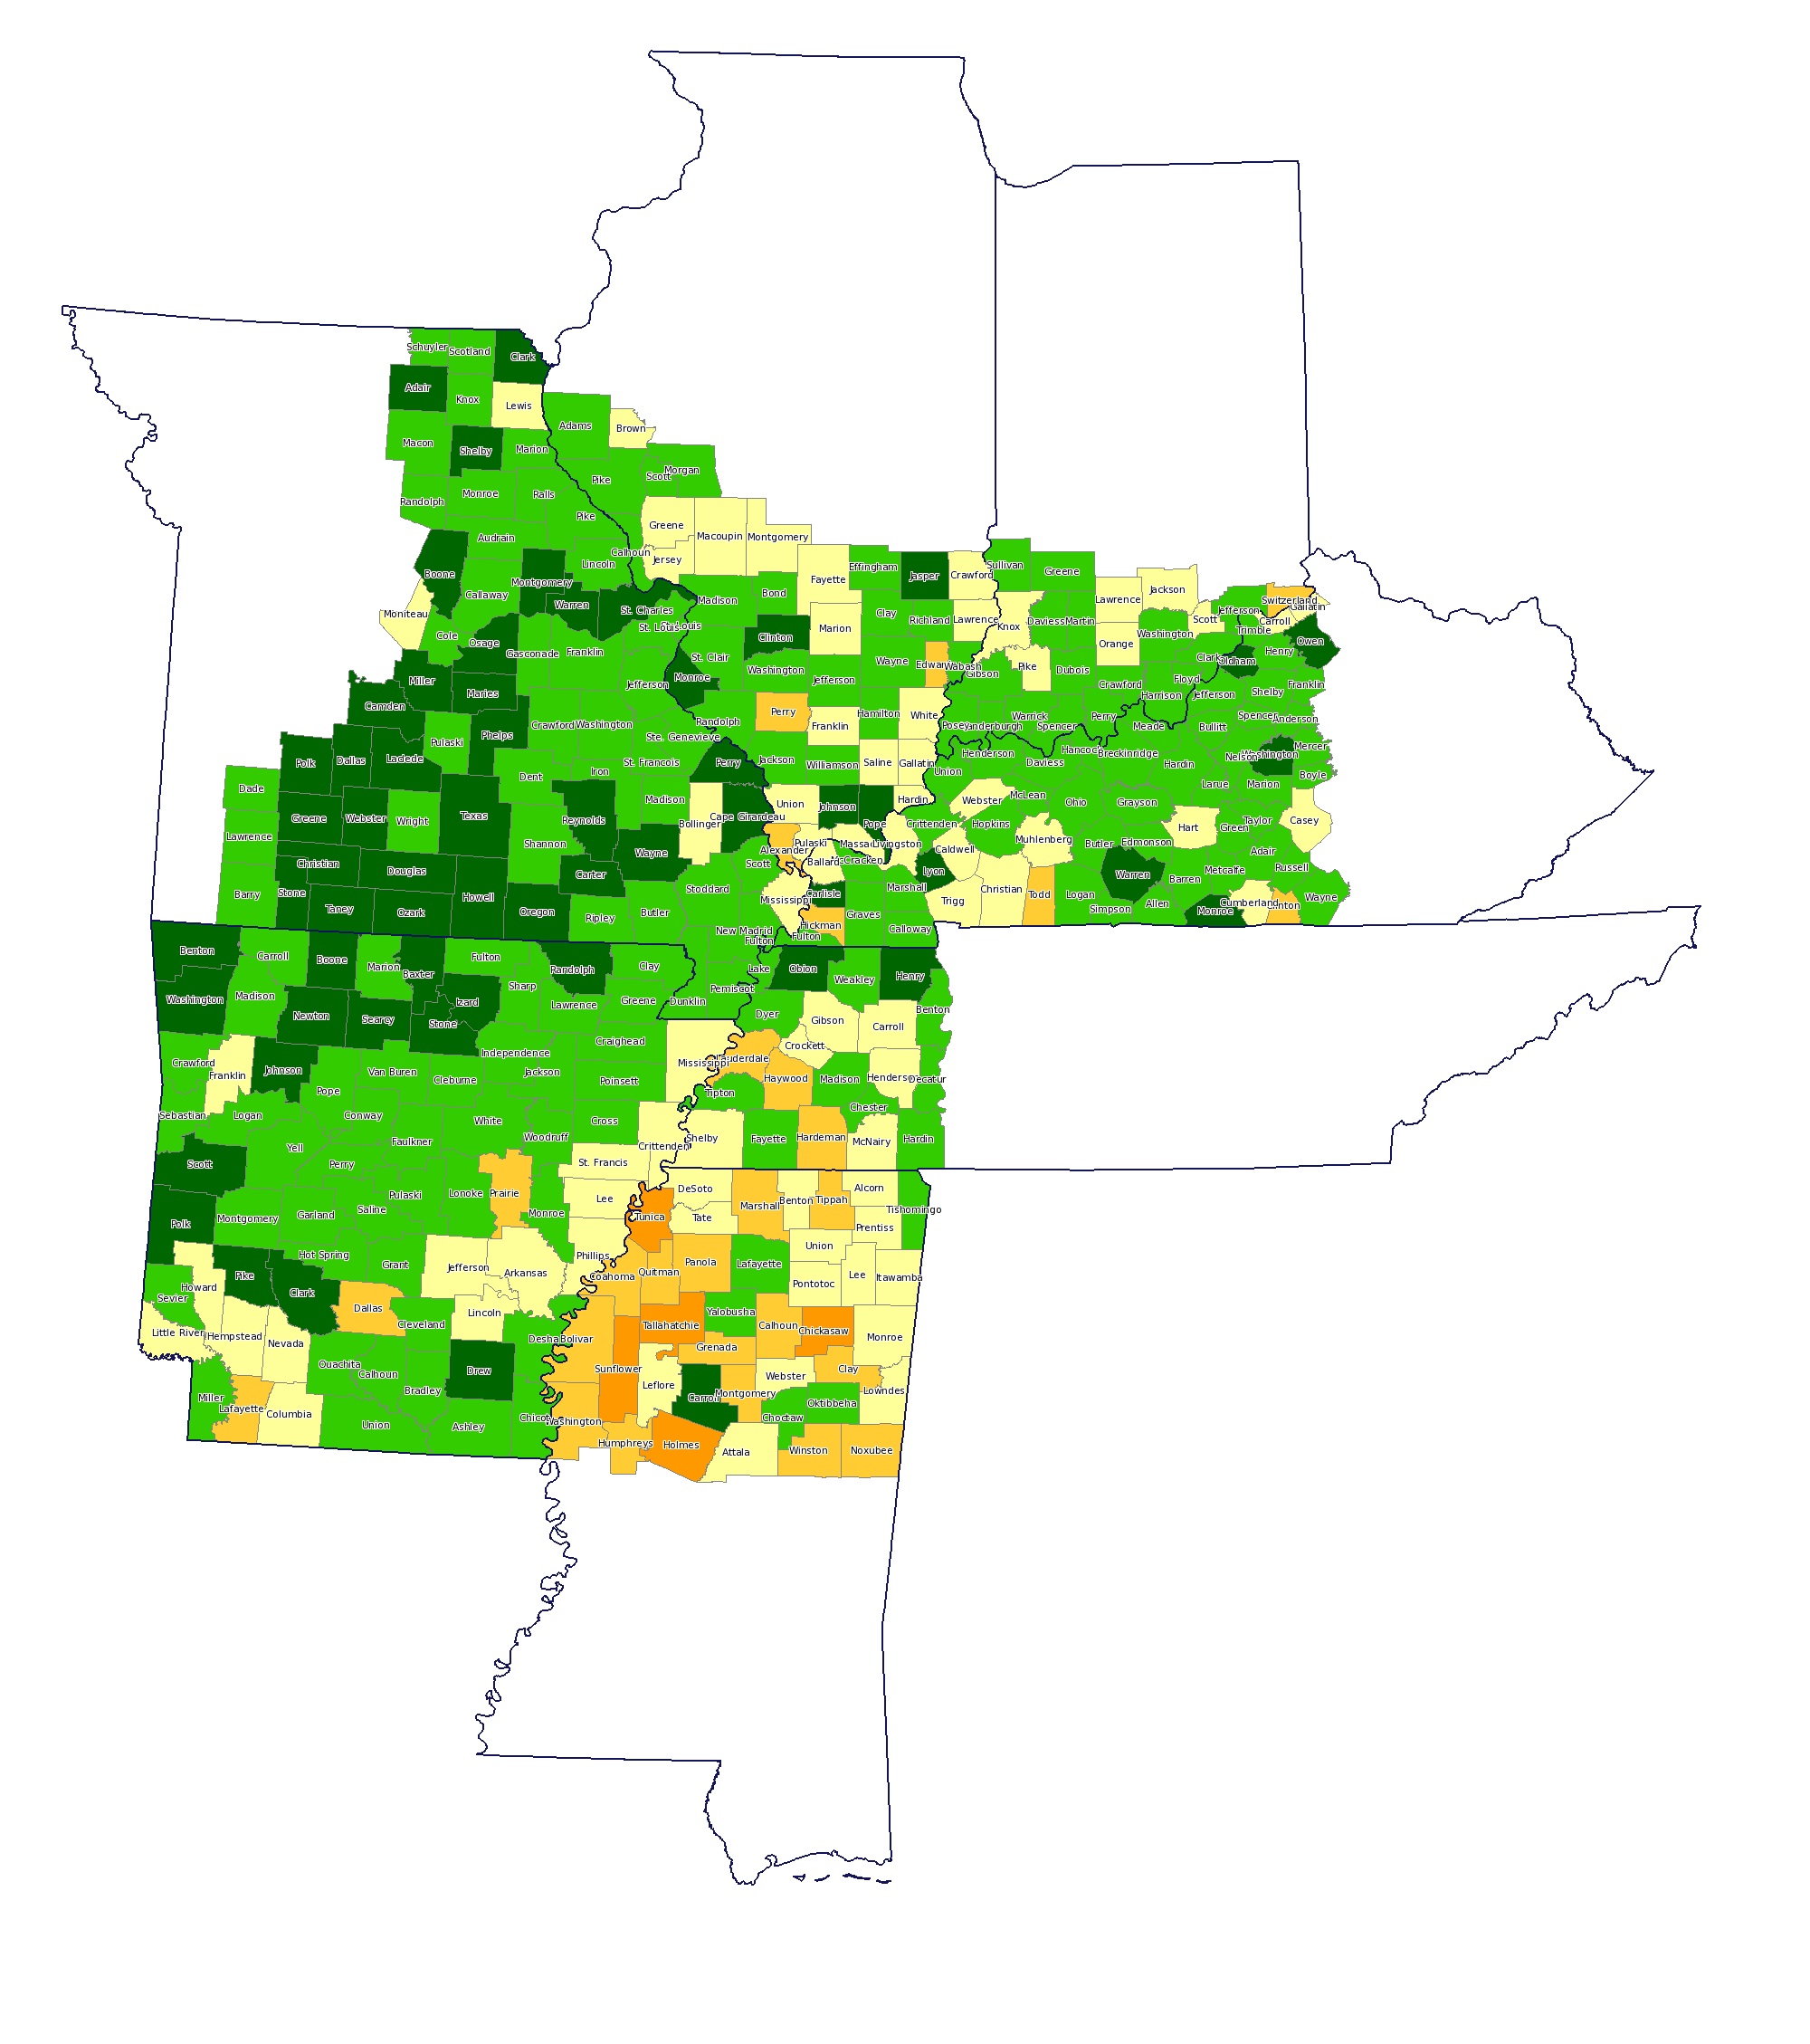
Source: Lender Processing Services
Map shows the share of mortgages in each county that were at least 90 days past due or in foreclosure.
Endnotes
- National Center for Policy Analysis. http://www.ncpa.org/sub/dpd/index.php?Article_ID=25643. [ back to text ]
- We use quarterly mortgage performance data from the Mortgage Bankers Association for the period Q1.1979 through Q3.2016. To control for seasonality and to reduce sampling error, we use four-quarter moving averages unless otherwise noted. [ back to text ]
- The unusual spike in Mississippi’s rate of serious delinquency before the foreclosure crisis is due to Hurricane Katrina, which made landfall on August 29, 2005. Mississippi was hit hard by the hurricane, as detailed in Mississippi Economic Policy Center (now Hope Policy Institute), “National Crisis Hits Home: Addressing Mississippi’s Mortgage Foreclosures,” 2008, available at http://winterinstitute.org/wp-content/blogs.dir/1/files/2012/08/MSmortgageForeclosure.pdf. [ back to text ]
This article originally appeared in our Housing Market Perspectives publication.

Citation
William R. Emmons, ldquoThe End Is in Sight for the U.S. Foreclosure Crisis,rdquo St. Louis Fed On the Economy, Dec. 2, 2016.
This blog offers commentary, analysis and data from our economists and experts. Views expressed are not necessarily those of the St. Louis Fed or Federal Reserve System.
Email Us
All other blog-related questions