Income Sources for the Highest- and Lowest-Earning Families
Knowing how much income families have is crucial to understanding economic well-being and the decisions people make. But how households earn that income can vary a great deal: In addition to their wages, many people get income from stocks and other investments, while others may rely on pensions, government payments or money from businesses they own.
How do the income sources for the highest-earning households in the United States differ from those of the lowest-earning households? To find out, I analyzed data from the 2022 Survey of Consumer Finances (SCF) from the Board of Governors of the Federal Reserve System. The triennial survey of household finances shows various sources of household income.
I broke down how six income streams combine to show total household earnings and how the composition changed based on how much the household earned. See the box for more information on the analysis.
The Highest Earners Had Uniquely Varied Income Sources
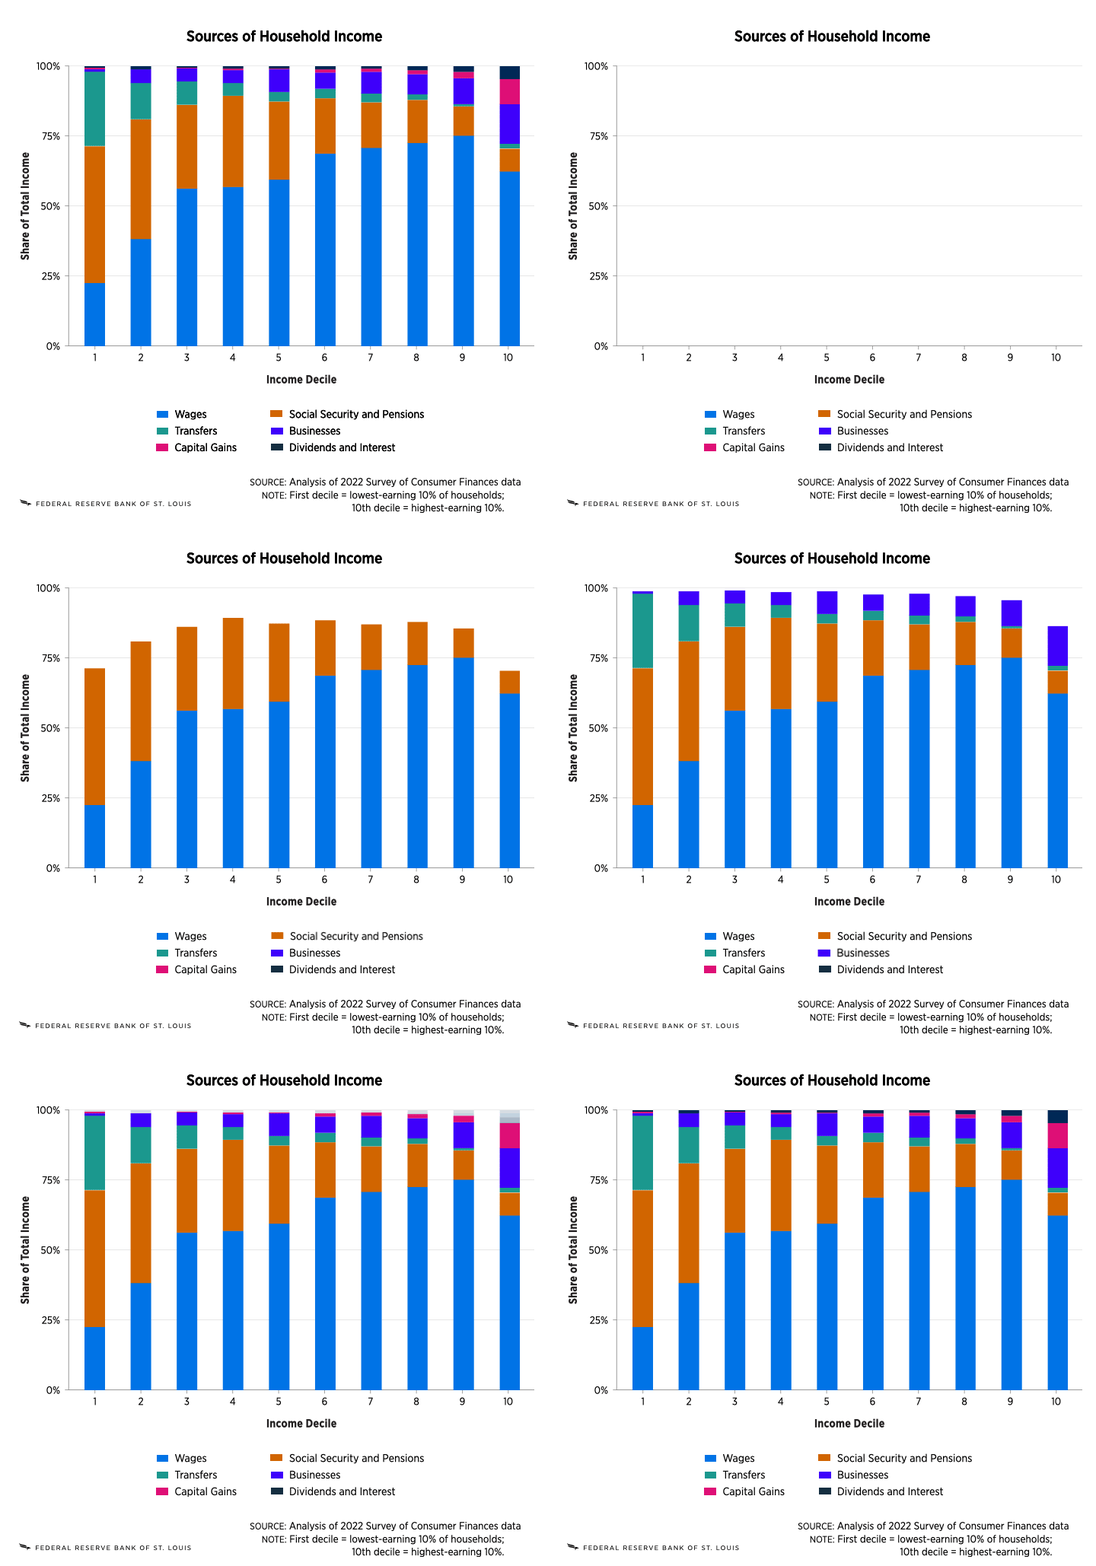
The graph below shows the decomposition of income sources. The highest-income households derived most of their income from wages (62%). However, they also had the most income of any decile from businesses, capital gains and dividends. This means they owned substantial real assets, such as companies and farms, as well as financial assets, such as stocks and bonds.
Income Sources Vary among Higher- and Lower-Earning Households

ADDITIONAL NOTES: Households are divided into deciles that each have 10% of all households. Households that earned negative income aren’t included.
In contrast, the second-highest income decile had an even greater share of income from wages (75%), but substantially less from businesses, dividends and capital gains. In total, these three income sources accounted for 28% of 10th-decile earnings, but only for 13% of ninth-decile earnings.
These differences suggest the highest-earning tenth of households had unique streams of income. While most of it did stem from wages, the percentage was less than for any of the other top five income deciles. Instead, the top-decile households could count on other varied sources, primarily businesses, as well as dividends and capital gains, which together can be deemed “passive” income. These income sources generally require less labor, which could make these households better able to weather economic shocks, since they are not as reliant on working for a wage to cover their expenses. If a single income source declines, these households can rely on other income streams.
Lowest-Earning Households Relied More on Government Payments
The income composition for the lowest-earning households was substantially different. Notably, wages accounted for only 23% of income, since many of the household heads might have been unemployed or retired. These households also earned very little from businesses, dividends and capital gains, implying they had little in the way of real or financial assets. Instead, almost half of their income came from Social Security payments and pensions (49%), with another 27% stemming from transfer income, which includes benefits such as unemployment payments, child support and food stamps.
First-decile households are by definition the lowest earners, which makes them more likely to qualify for unemployment benefits and other forms of social assistance. The share of income from transfer payments was larger than that for any other decile.
While the highest-earning households’ income composition offers them multiple significant streams of income and the ability to weather turbulent financial times, the opposite is true for the lowest-earning households. Social Security, pension and transfer payments tend to be fixed, or at least are difficult to change by working longer hours or changing jobs. This means the households that rely on them might not be well equipped to weather changes in the economic environment. While Social Security payments are indexed to inflation, pensions and transfer payments might not be, meaning that higher inflation could make it more difficult for these households to cover costs such as food and housing, for example.
The Highest and Lowest Earners Are the Oldest
Overall, both the highest- and lowest-earning households relied relatively less on their wages for their income relative to other deciles near their income range. For the 10th decile, this was largely because they owned assets that provided them with passive income. On the other hand, first-decile households depended largely on Social Security and pensions, as well as transfers.
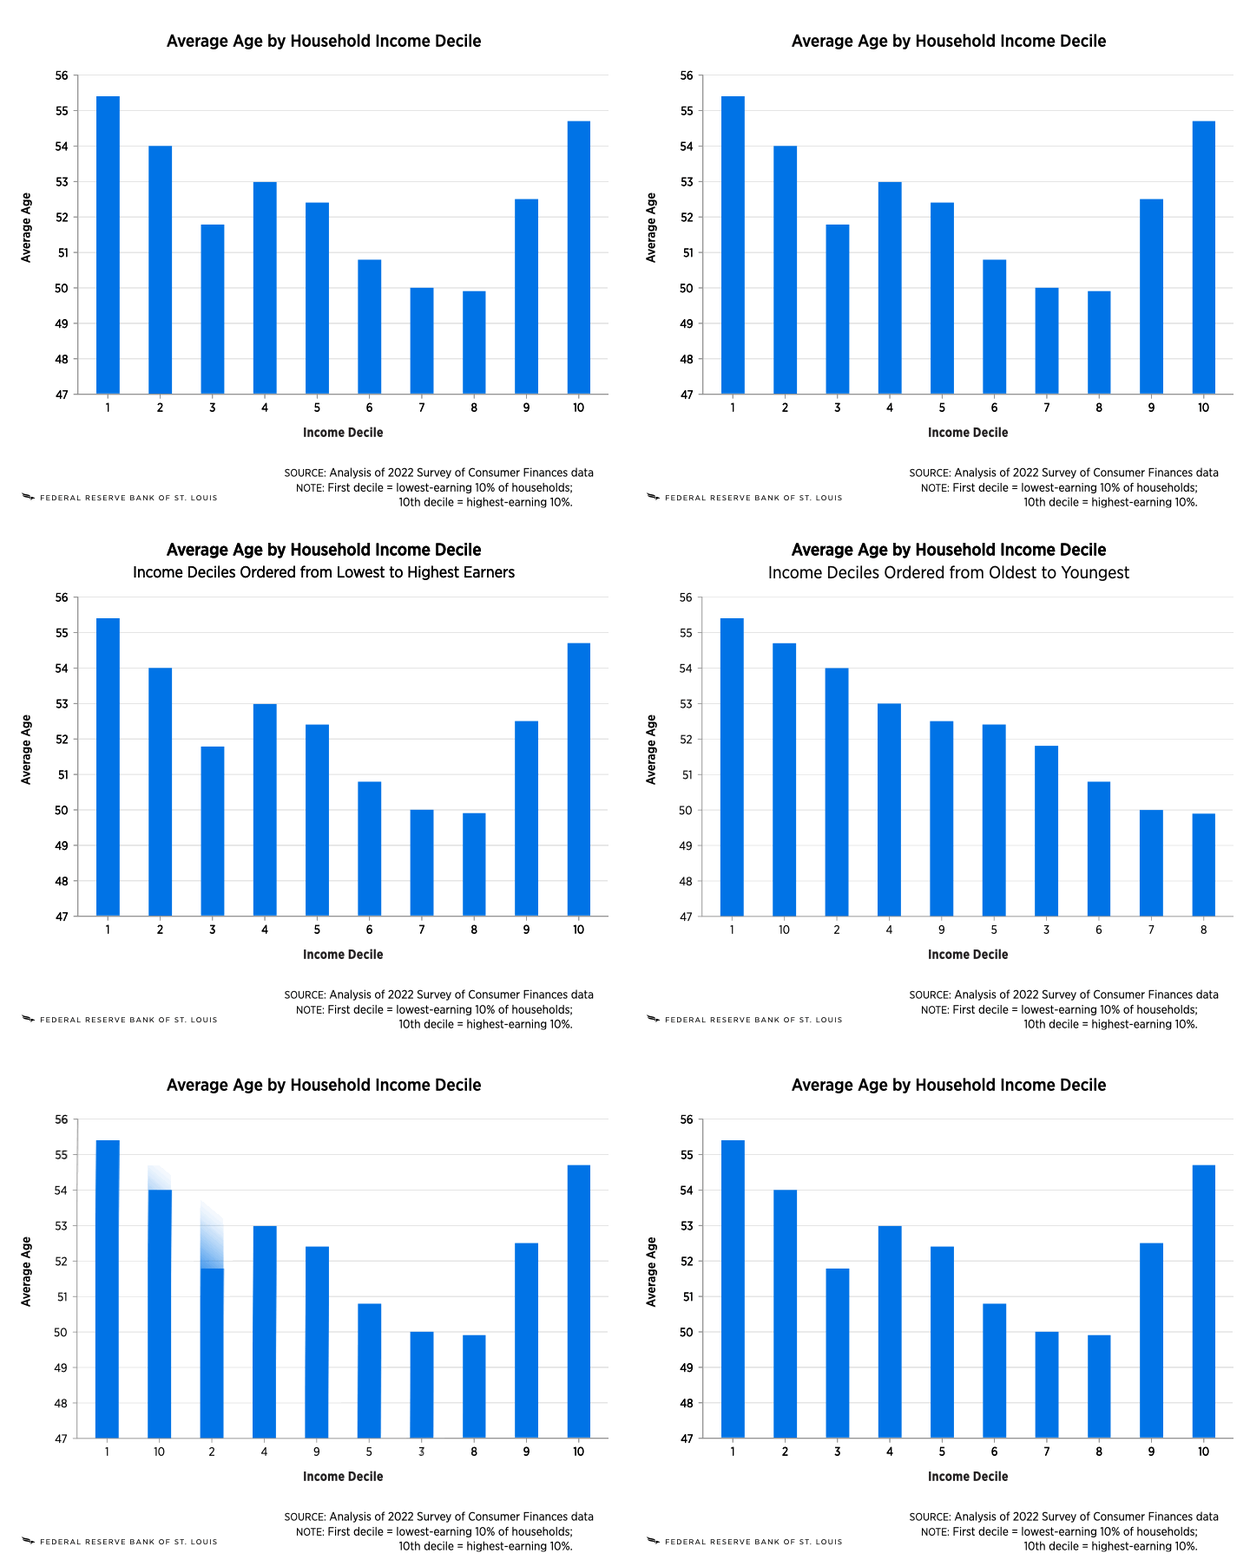
Based on this evidence, I hypothesized that older retirees might concentrate among the highest and lowest earners, rather than in the middle. The graph below shows the average age for each income decile and confirms this: The lowest-earning decile was indeed the oldest, partly explaining why those households depended so heavily on Social Security and pensions. The second oldest was the 10th decile. This might explain the highest earners’ lower reliance on wages relative to other high earners: Many of those in the 10th-decile households were already retired and instead earning passive income, since they had had a longer time to accumulate real and financial assets.
The Highest and Lowest Earners Were the Oldest on Average

ADDITIONAL NOTES: Households are divided into deciles that each have 10% of all households. Households that earned negative income aren’t included.
Sources Can Affect How Easily Income Can Be Changed
To summarize, the composition of household income varied substantially based on the overall level of income. The highest-income households had significant streams of passive income, which made them less reliant on their wages and potentially more resistant to economic fluctuations, given that they had other sources of income to draw from. The significance of passive income is notable, even compared with the households that earned slightly less. The highest-earning households tended to be older and more likely to be retired, explaining the lower share of wage income.
In contrast, the lowest-income households earned most of their income from Social Security, pensions and transfer payments. These households were also older, explaining why they could collect Social Security and pensions and had less wage income. Since those households often have less control over the size of the payments, they might have less flexibility to adjust their income to cover potential increases in costs or economic fluctuations.
This blog explains everyday economics and the Fed, while also spotlighting St. Louis Fed people and programs. Views expressed are not necessarily those of the St. Louis Fed or Federal Reserve System.
Email Us


