


Demographic Disparities in COVID-19 Disruptions: What Has Shaped Them?
Abstract
This article uses the Community Impact Survey implemented by the Federal Reserve System in 2021 to identify COVID-19 disruptions on low- to moderate-income communities. I find that communities that were primarily of Color were more likely to be significantly disrupted by COVID-19 than White communities. I also assess the importance of certain challenges, such as returning to work or unequal access to government relief, in shaping the observed demographic differences in disruption.
Introduction
In the past years, we have seen waves of COVID-19 infections disrupting communities in the United States. The pandemic has interfered with lives across the country, and its effects on low- to moderate-income (LMI) individuals and communities have been significant. Though the peak of distress has passed, people of Color are still bearing major disturbances. Figure 1 shows that at the peak of COVID-19, distressed communities were facing serious disruptions regardless of demographic composition. However, 18 months into the pandemic, communities of Color were 20 percentage points more likely to be significantly disrupted than White communities even though the disruptions had already halved.
Figure 1: General Economic Disruption
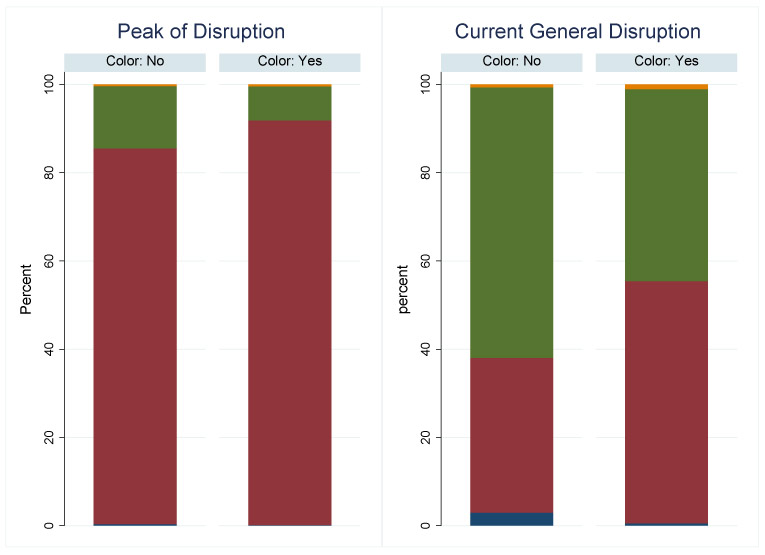
NOTE:The figure shows the percentage of respondents who reported disruption at the peak of distress (left panel) and at the time of the survey (right panel) for entities serving communities that were primarily of Color and those that were not.*
*Questions on disruption were the following: "Thinking about the period of peak distress caused by the pandemic, what level of disruption did COVID-19 have on economic conditions in your community at that time?" "Currently, what level of disruption is COVID-19 having on economic conditions in your community?"
This article analyzes a different and unique channel to assess the disruption gap between the two communities—unequal access to government COVID 19 relief—and compares it with other possible explanations, such as challenges returning to work. Government relief has been very critical to LMI communities (Chalise and Gutkowski, 2021). It has kept millions out of poverty, helped people access health coverage, and reduced hardships like the inability to afford food or meet other basic needs (Budget and Policy Priorities, 2021). Nevertheless, equally distributing these funds was challenging. Holtzblatt and Karpman, 2020 show that the receipt of Economic Impact Payments from the CARES Act occurred more slowly—or not at all—for some groups. Having no recent history of filing taxes, lacking internet access, and being unbanked were some of the barriers to receiving government payments. Many were also excluded from unemployment benefits. For example, people of Color who often work in low-wage or part-time jobs, or as independent contractors, may have been more likely to be excluded or not eligible for regular unemployment insurance (Janger, Rubin, and Singh, 2020).
Furthermore, not all small businesses had access to Paycheck Protection Program (PPP) loans due to lack of eligibility, burdensome paperwork, and lack of knowledge and understanding of the program. According to Liu and Parilla, 2020, it took 31 days for small businesses with paid employees in majority-Black zip codes to receive PPP loans—7 days longer than those in majority-White communities. Lack of a bank relationship was also a burden. The initial demand for loans significantly exceeded the ability of banks to deliver them, and they appear to have prioritized firms with which they had a preexisting relationship (Granja et al., 2022; Li, Strahan, and Zhang, 2020). Thus, larger firms—which tend to have ongoing bank relationships—accessed PPP funds sooner than smaller firms, on average.
I find that unequal access to government relief plans was as important as challenges in returning to work in explaining variation in disruption between White communities and communities of Color. Returning to work has been particularly challenging to many due to risk of exposure, lack of childcare, or lack of public transportation. Together, these challenges can explain approximately 30 percent of the disruption gap. These findings highlight the importance of targeting, implementing, and distributing government relief packages and the relevance of childcare in the US economy.
The difference in the disruption across demographics groups could be explained by a variety of factors. For example, Maxwell, 2020 suggests that economic hardship, food and housing insecurity, and unequal access to mental healthcare services could have contributed to explaining differences in the overall disruption caused by COVID-19. Gemelas, Davison, et al., 2022 show that people of Color experienced larger income losses, which could have made it harder for them to make ends meet. In addition, workers in communities of Color had less ability to telecommute, which may have resulted in unequal health risks affecting overall employment and labor force participation (OECD, 2022).
Differences in access to healthcare and health insurance could also have contributed to the gap. Gangopadhyaya, Karpman, and Aarons, 2020 show that between late April and mid-July, more than three million adults lost employer-sponsored insurance (ESI). These losses were concentrated among Hispanic adults, young adults, men, and adults who did not attend college. Though the reduction in ESI was partially offset by a rise in public coverage, groups that faced the largest ESI losses also saw the largest increases in uninsurance.

Citation
Violeta Gutkowski,
ldquoDemographic Disparities in COVID-19 Disruptions: What Has Shaped Them?,rdquo
Federal Reserve Bank of St. Louis
Review,
Fourth Quarter 2023, pp. 261-79.
https://doi.org/10.20955/r.105.261-79
Editors in Chief
Michael Owyang and Juan Sanchez
This journal of scholarly research delves into monetary policy, macroeconomics, and more. Views expressed are not necessarily those of the St. Louis Fed or Federal Reserve System. View the full archive (pre-2018).
Email Us