Where People Live Plays a Role in the Pandemic's Financial Effects
How much has the health crisis hurt the finances of the people in your neighborhood?
The answer could depend in part on which county or state you live in: The COVID-19 pandemic and responses to it affect the finances of people in different areas of the country differently.
A roundup of some recent St. Louis Fed articles may shed some light on how quickly U.S. gross domestic product (GDP) could recover, where the extra $600 in weekly unemployment insurance benefits goes the farthest, and whether consumers across the U.S. were financially ready for the pandemic from a household debt standpoint.
Some of the takeaways from the analyses:
- Some geographic areas account for higher shares of U.S. output than others, meaning that how quickly the economy recovers could depend on the timing of areas' reopening.
- An additional $600 per week in unemployment benefits under Congressional relief legislation will go farther for a family in Ohio than for a family in New York.
- People in Sun Belt states may have been less prepared for the financial jolts from the pandemic.
Shares of Population and GDP
The United States has more than 3,000 counties. Just 81 of them accounted for half of the nation’s GDP in 2018, according to a March 6 article by B. Ravikumar, a St. Louis Fed senior vice president and deputy director of research, and Brian Reinbold, a research associate with the Bank.
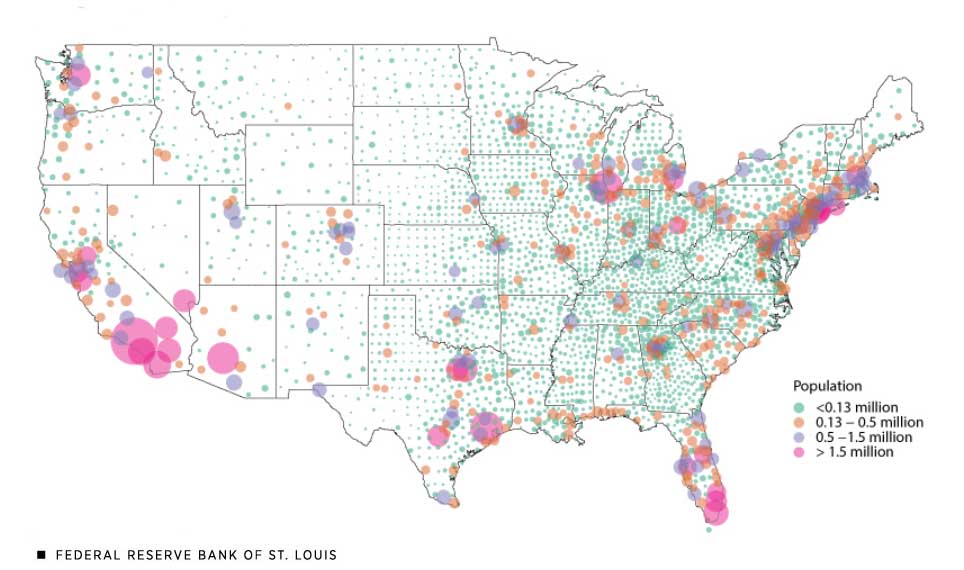
In a May 6 article, Ravikumar and Ryan Mather, a former St. Louis Fed research associate, noted that much of the U.S. population is concentrated on the coasts and that the Northeast and California have large clusters.
Those also are the areas with the most GDP, or output. GDP serves as a gauge of our economy’s overall size and health, measuring the total market value of all goods and services produced in a given year.
U.S. Population Is Concentrated on the Coasts

SOURCE: U.S. Census Bureau. The map is Figure 2 in “Geographic Disparity in the U.S. Population,” an Economic Synopses article by B. Ravikumar and Ryan Mather published May 6, 2020.
NOTES: A map of the United States shows the geographic distribution of the U.S. population across all counties in 2018. Each county in the figure is represented by a circle whose size corresponds to the number of people living in that county. Circles appear in one of four colors, with a pink circle indicating the largest population, more than 1.5 million, and a light green circle indicating the smallest, less than 130,000. The map shows that much of the U.S. population is concentrated on the coasts.
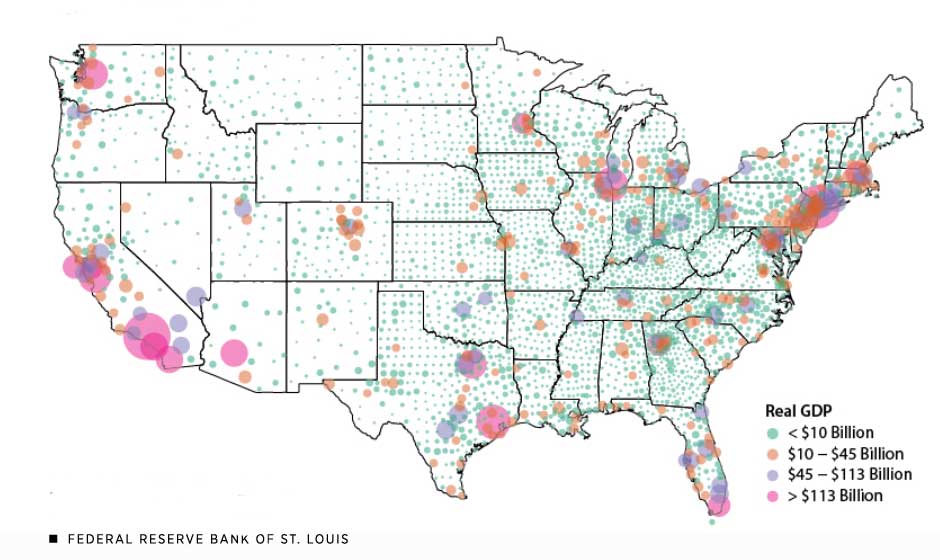
U.S. Population Centers Have the Most GDP

SOURCES: U.S. Bureau of Economic Analysis and authors’ calculations. The map is Figure 2 in “Geographic Disparity in U.S. Output,” an Economic Synopses article by B. Ravikumar and Brian Reinbold published March 6, 2020.
NOTES: A map of the United States, excluding Alaska and Hawaii, shows 2018 GDP for the U.S., where a circle represents a county. A bigger circle indicates more output, and a smaller circle represents less. Circles appear in one of four colors, with a pink circle indicating the largest output, more than $113 billion, and a light green circle indicating the smallest, less than $10 billion. The figure shows that much of U.S. output is concentrated in the Northeast and in California near the Bay Area and Los Angeles.
With $711 billion, Los Angeles County had the largest GDP in 2018, according to the March 6 article. The county also is the largest in terms of population, with 3% of the U.S. population, as noted in the May 6 article.
“Output is highly correlated with population; that is, most of the workers in the U.S. live in just a few localities—counties with major cities—that produce most of the output,” Ravikumar and Reinbold said.
What does having so much output produced in less than 3% of the nation’s counties mean for the U.S. economy as it works through the pandemic effects?
In an April 28 blog post, Ravikumar and Mather wrote that whether U.S. GDP recovered quickly from the COVID-19 pandemic depended on which areas reopened when, since “U.S. output is not evenly produced across various geographic areas of the country.” The post also was co-authored by Guillaume Vandenbroucke, a research officer and economist.
Where $600 Goes Farthest
Among other assistance, an extra $600 a week in unemployment benefits until July 31 was included in the Coronavirus Aid, Relief and Economic Security Act, or the CARES Act. Anyone eligible for the benefits receives the same supplement, no matter which state they live in.
“However, the purchasing power of $600 varies substantially across states hit hardest by the pandemic,” wrote YiLi Chien, a research officer and economist, and Julie Bennett, a research associate, in an April 28 article.
Because of higher living expenses in some states, there are differences in how much of their bills families can pay with $600 a week, and how much the supplement ends up being worth over the four months it’s offered.
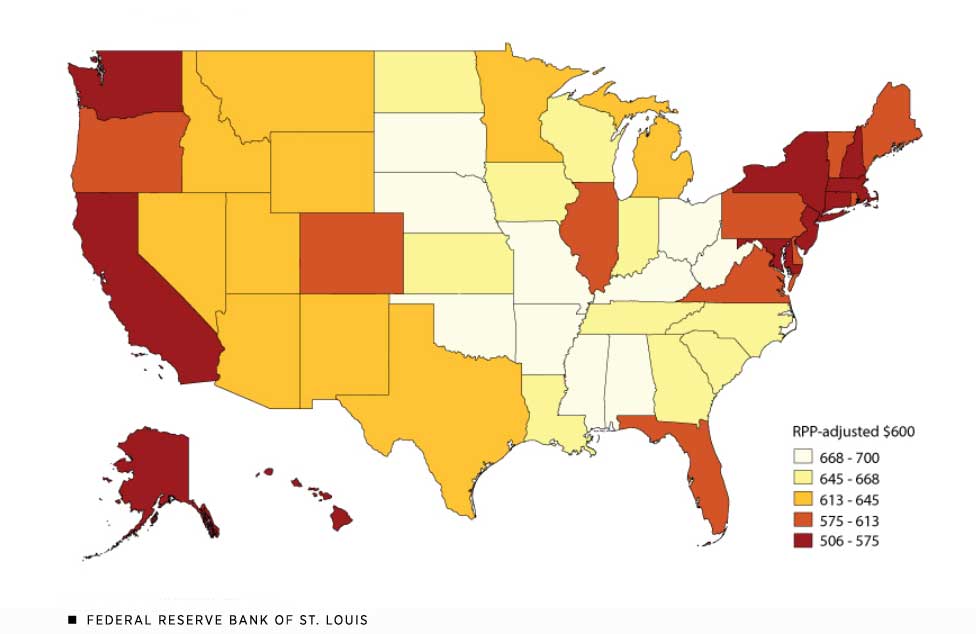
The Value of $600 Varies by U.S. State

SOURCES: U.S. Bureau of Economic Analysis and authors’ calculations. The map is from “The Value of $600 Across States Hit Hardest by COVID-19,” an Economic Synopses article by YiLi Chien and Julie Bennett published April 28, 2020.
NOTES: A shaded U.S. map shows the purchasing power of $600 across states; values were adjusted based on regional price parities in 2017 from the U.S. Bureau of Economic Analysis. States with the lowest buying power ($506 to $575) are indicated by dark red shading; these include states in the Northeast and on the West Coast. States with the highest buying power ($668 to $700) are indicated by cream shading; these include some states in the South and in the Midwest.
Chien and Bennett compared buying power in all states as well as in states hit hardest by the pandemic, from both a public health and economic perspective. Using regional price indexes for 2017 from the Bureau of Economic Analysis, they found that the $600 supplement would be worth the most in Mississippi (at $700) and the least in Hawaii (at $506).
Focusing on the states hit hardest by the pandemic, the authors found that the supplement would have the most purchasing power in Ohio—$675—and the least in New York—$518. That works out to $2,826 more in buying power for Ohioans over four months.
By the Numbers
$600 supplement to weekly unemployment benefits for eligible claimants
$675 purchasing power of the supplement in Ohio
$518 purchasing power of the supplement in New York
$2,826 more buying power an Ohio claimant would have over four months than a New York claimant
Chien and Bennett wrote that the comparison raises a question: Is it equitable to give an equal unemployment benefits supplement across states? The comparison also raises the same question for the $1,200 relief check distributed to many households, they said.
The argument could be made that people who face higher costs for essentials such as housing and food should receive higher supplements, according to the article.
But having a flat amount has advantages, the authors said: For example, it likely speeds up the transfer of the money to recipients, and it also could have helped hasten the passage of the act since lawmakers could avoid debating what the appropriate amount would be for each region.
Debt Delinquency by State before the Pandemic
Was the average household financially ready for the pandemic?
Carlos Garriga, a vice president and economist, and Matthew Famiglietti, a research associate, examined this question in a May 13 blog post. They looked at household debt trends through March and also at the share of delinquent debt across U.S. states for that month. (Delinquent debts were those that hadn’t been paid for at least two months.)
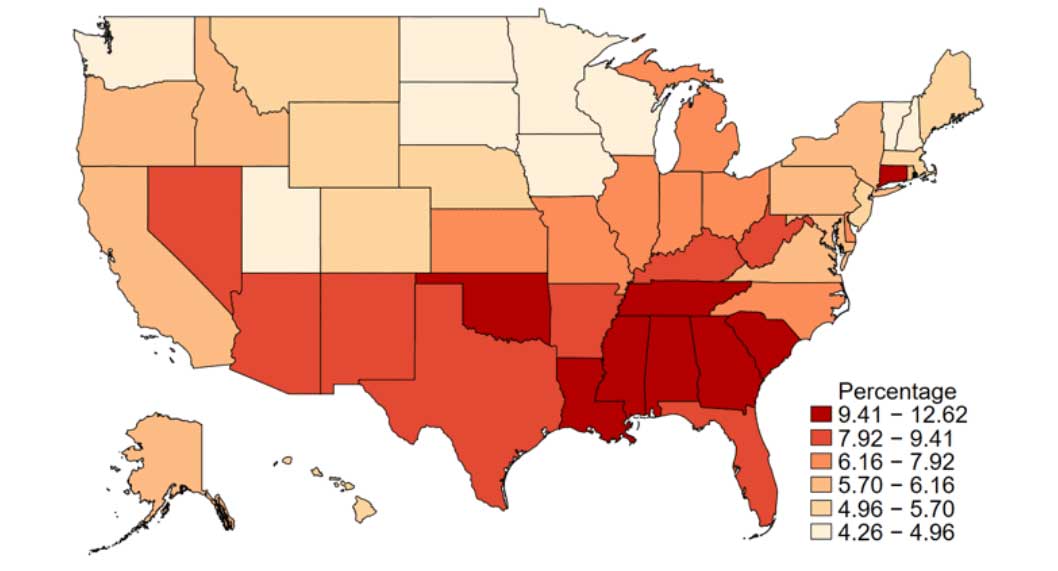
The authors found that a larger percentage of consumers in most Sun Belt states were struggling to make payments than those in other parts of the country. These states had disproportionately large shares of debt delinquency, the authors noted.
In seven Southern states, 9.41% to 12.62% of consumer credit lines were delinquent as of March, as shown in the map below. In some Upper Midwest and Northeastern states, meanwhile, less than 5% of consumer credit lines were delinquent.
Southern States Had a Higher Percentage of Delinquent Consumer Debt

SOURCES: Federal Reserve Bank of New York/Equifax Consumer Credit Panel and authors’ calculations. The map is from “Ready for the Pandemic? Household Debt before the COVID-19 Shock,” an On the Economy Blog post by Carlos Garriga and Matthew Famiglietti published May 13, 2020.
NOTES: A shaded U.S. map shows in dark red that seven Southern states had delinquency rates for consumer debt from 9.41% to 12.62% in March, while some Upper Midwest states, in light beige, had less than 5% of consumer debts delinquent. Delinquent debts were those that hadn’t been paid for at least two months. The share represents delinquent debts as a percentage of estimated debts owed by consumers in that state.
The blog post also noted that mortgage loan delinquency has been declining for the U.S. as a whole in the last two years, while delinquency was increasing for some other types of debt, including auto finance and student loans.
The CARES Act included provisions for deferring debt payments on federally backed mortgages and student loans for extended periods, the authors wrote.
“However, given these trends, more focused debt relief may need to arrive for consumers without mortgages and for consumers in specific geographic regions,” they said.
This blog explains everyday economics and the Fed, while also spotlighting St. Louis Fed people and programs. Views expressed are not necessarily those of the St. Louis Fed or Federal Reserve System.
Email Us


