Reopening the U.S.: Gauging the Trend of COVID-19 Transmissions
There are more than 3,000 counties in the U.S. In 2018, a mere 17 counties accounted for 25% of total real U.S. gross domestic product (GDP); 80 counties accounted for 50%. Since U.S. output is not evenly produced across various geographic areas of the country, whether U.S. GDP recovers quickly from the COVID-19 pandemic depends on which areas reopen and when they do.
Among the proposed criteria for reopening a region, the White House listed “downward trajectory of documented cases within a 14-day period.”See White House. “Proposed State or Regional Gating Criteria.” This blog post examines the spread of U.S. COVID-19 cases over time and across space.
COVID-19 Cases and County-Level GDP

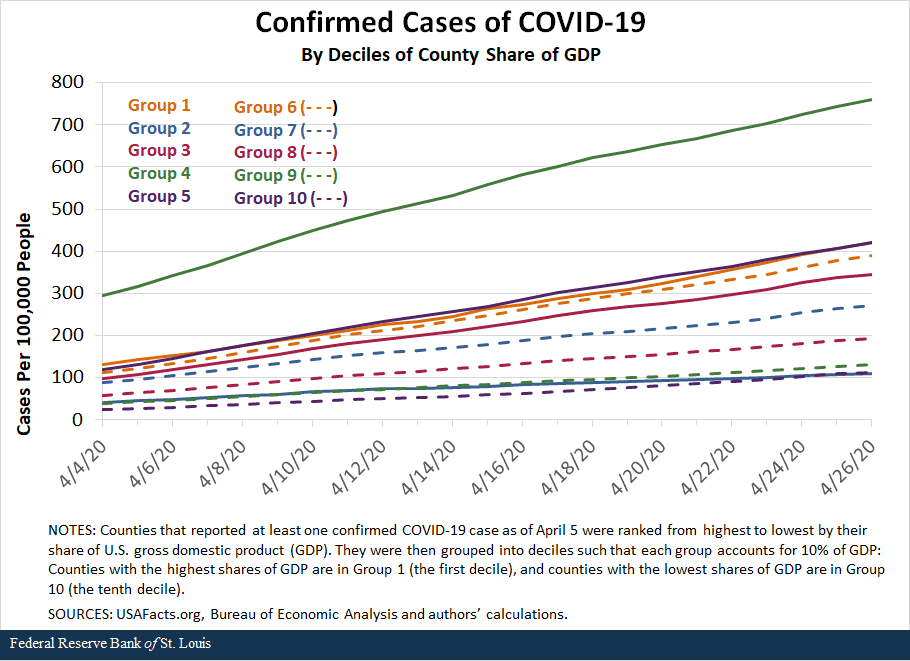
The figure above illustrates the incidence of COVID-19 cases over time and across U.S. counties that reported the illness; in our sample of counties with GDP data, there were 2,361 counties that had at least one confirmed COVID-19 case as of April 5.This excludes 736 counties that had zero cases as of April 5; these areas together accounted for only 1.8% of U.S. GDP in 2019. Our analysis also excludes counties that do not have GDP data from the BEA.
These counties are ranked from highest to lowest by their share of U.S. GDP. They are then grouped into deciles such that each group accounts for 10% of GDP: Counties with the highest shares of GDP are in Group 1 (the first decile), and counties with the lowest shares of GDP are in Group 10 (the tenth decile).
Of these, Group 1 has only three counties, and Group 2 has seven counties, while Group 10 has more than 1,500 counties.
As of April 26, 2020, none of the 767 counties in the first nine groups displayed a downward trajectory of confirmed cases over the previous 14 days. Thus, strictly speaking, none of the counties that produce 90% of U.S. GDP currently meet the White House guidelines to reopen. In Group 10, those counties that did display a downward trajectory account for just 0.01% of U.S. GDP.
The Prospect of a Downward Trajectory
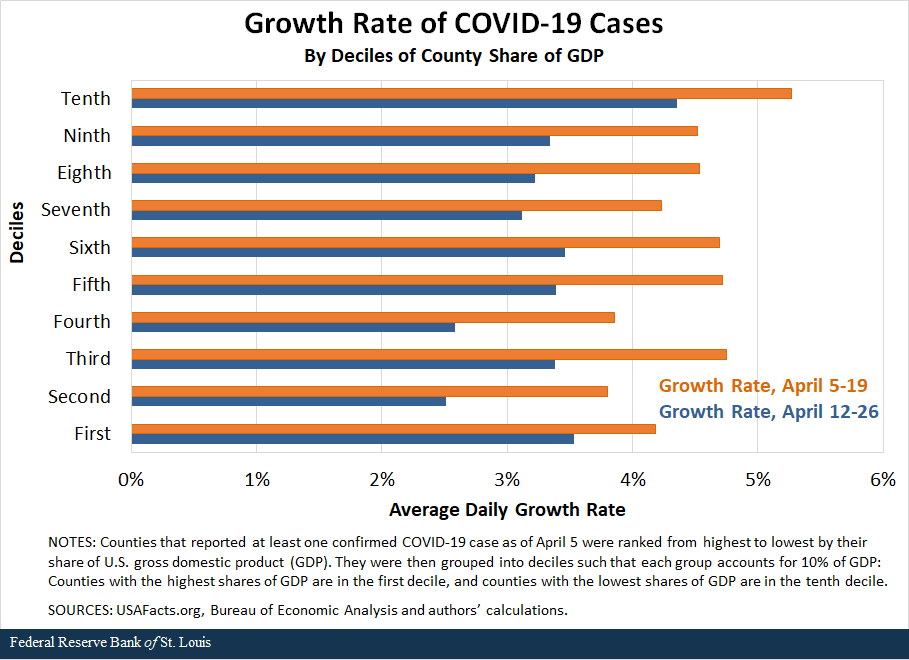
However, if groups exhibit a decrease in the growth rate of cases, they have the potential to display a downward trajectory in the near future. The figure below illustrates the average daily growth rate of COVID-19 cases from April 12-26 (the blue bars) and the average daily growth rate of cases from April 5-19 (the orange bars) for each decile.

As is evident from the figure, the blue bars are shorter than the orange bars, which suggests that the average daily growth rate of cases in each decile has decreased. All of the growth rates are positive, however, so none of the groups display a downward trajectory.
A Closer Look at County-Level Growth Rates of COVID-19
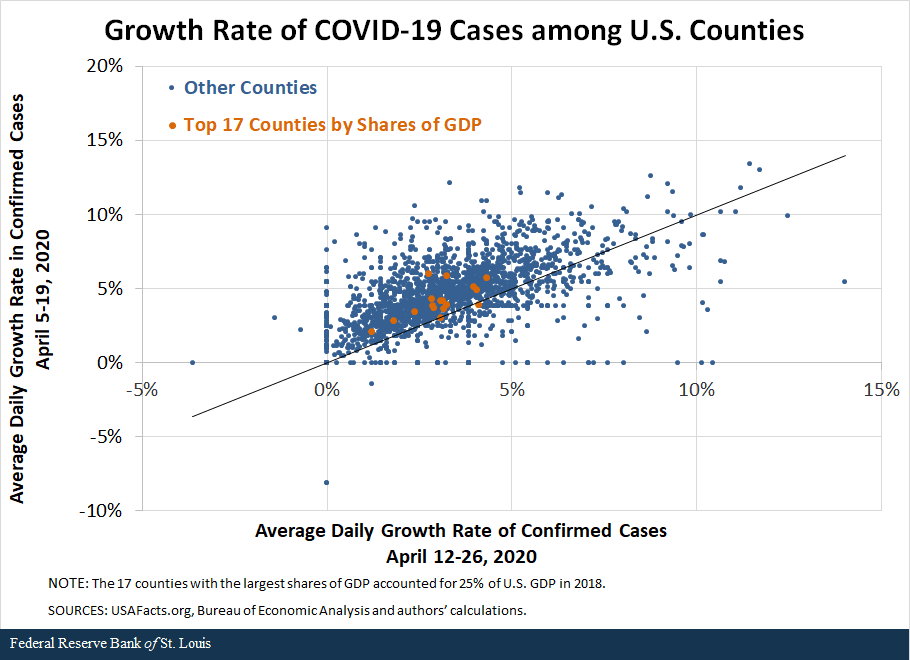
The figure below illustrates more details. It displays the average daily growth rates of the two time periods at the county level for our entire sample of 2,361 counties. The orange dots indicate the 17 counties with the largest shares of GDP; in total, they accounted for 25% of GDP in 2018.

If the scatter plots aligned roughly with the 45-degree line, then the inference would be that the growth rate, on average across counties, has not decreased. On the other hand, if the scatter plots aligned above the 45-degree line, then the inference would be that the average daily growth rate from April 12-26 has decreased from the growth rate in the earlier period, April 5-19. This is indeed the case in the figure above.
For example, New York County (Manhattan) is one of the three counties in the first decile (Group 1). From April 5-19, its daily growth rate in cases was 3.46%. From April 12-26, however, its daily growth rate was over a percentage point lower, at 2.35%. In fact, all of the counties in the top two deciles of GDP are slowing on this metric, except for Los Angeles County.
Conclusion
None of counties in the top nine deciles displayed a downward trajectory of confirmed cases over the previous 14 days. However, a total of 1,762 counties accounting for 89% of GDP had a lower growth rate in the recent two weeks, which suggests a possibility of downward trajectory in the near future. Furthermore, almost all of the counties in the top two deciles—which together account for 20% of GDP—had a lower growth rate of cases in the last two weeks compared to our reference period of April 5-19.
Notes and References
1 See White House. “Proposed State or Regional Gating Criteria.”
2 This excludes 736 counties that had zero cases as of April 5; these areas together accounted for only 1.8% of U.S. GDP in 2019. Our analysis also excludes counties that do not have GDP data from the BEA.
Additional Resources
- On the Economy: Is the U.S. Looking Like Italy? Projections on COVID-19 Death Rates
- On the Economy: The Impact of COVID-19 on Labor Markets across the U.S.
Citation
B. Ravikumar, Guillaume Vandenbroucke and Ryan Mather, ldquoReopening the U.S.: Gauging the Trend of COVID-19 Transmissions,rdquo St. Louis Fed On the Economy, April 28, 2020.
This blog offers commentary, analysis and data from our economists and experts. Views expressed are not necessarily those of the St. Louis Fed or Federal Reserve System.
Email Us
All other blog-related questions


