


What Is Quantitative Tightening?
Several years ago, the term “quantitative easing” was commonplace in discussions about the Federal Reserve and monetary policy. More recently, you might have heard “quantitative tightening.”
What do quantitative easing and tightening mean? Quantitative easing, or QE, refers to policies that substantially expand the size of the Fed’s balance sheet. Quantitative tightening, or QT, refers to the opposite—policies that reduce the size of the Fed’s balance sheet.
Let's Back Up...
The U.S. experienced a financial crisis and recession during the period 2007-09. The Fed took unprecedented steps to boost the economy during that period and several years into the subsequent economic recovery.
These actions were meant to put downward pressure on interest rates, thereby easing financial conditions and stimulating the economy.
Near-zero policy rate
The Fed’s main monetary policymaking body, the Federal Open Market Committee (FOMC), established a target range for the federal funds rate (that is, the policy rate) of 0%-0.25% in December 2008 and kept it there for seven years. The FOMC also used forward guidance during that period to indicate how long or under what economic conditions the policy rate would likely remain near zero.
Quantitative easing
With the policy rate near zero, the FOMC used three large-scale asset purchase programs (that is, QE) in an effort to reduce longer-term interest rates.From late 2011 to the end of 2012, the FOMC also used a maturity extension program (often called “Operation Twist”), which involved selling or redeeming shorter-term Treasury securities and purchasing longer-term Treasury securities. The purpose of this program was also to reduce longer-term interest rates.
The Fed mostly purchased longer-term Treasury securities and mortgage-backed securities.During the three QE programs, the Fed purchased the following types of securities:
— QE1: agency debt (direct obligations of Fannie Mae, Freddie Mac and the Federal Home Loan Banks), mortgage-backed securities and longer-term Treasuries
— QE2: longer-term Treasuries
— QE3: mortgage-backed securities and longer-term Treasuries
The last round of quantitative easing ended in October 2014. The FOMC maintained the size of the balance sheet until late 2017.
The FRED graph below shows:
- The effective federal funds rate (blue line, left scale), which remained near zero for several years.
- The total size of the Fed’s balance sheet (red line, right scale), which rose from less than $900 billion before the recession (marked by the shaded area) to about $4.5 trillion at the balance sheet’s peak.
Normalizing Monetary Policy
In light of the improvement in labor market conditions and expectations that inflation would return to the Fed’s 2% inflation target, the FOMC in December 2015 took the first step toward returning the policy rate to a more neutral level. The FOMC raised the target range for the federal funds rate from 0%-0.25% to 0.25%-0.5%.
Another increase in 2016, three increases in 2017, and four increases in 2018 brought the target range for the federal funds rate to 2.25%-2.5%.
After the policy rate had been raised a few times, the FOMC decided to begin reducing the size of the balance sheet, as announced in September 2017. The balance sheet normalization program began the next month, in October 2017.
A popular Open Vault blog post last summer explained the process of slowly reducing the Fed’s balance sheet (that is, “unwinding” it):
Here’s how it works: When Treasury securities reach their maturity date, they are paid off by the government; mortgage-backed securities are paid off by Fannie Mae and Freddie Mac. [St. Louis Fed Deputy Director of Research David] Wheelock explained that the Fed had “been going out in the market and replacing those securities with purchases of other securities so as to keep the balance sheet constant. And the idea of unwinding the balance sheet is simply stopping the replacement of securities that mature.”
The Fed’s Balance Sheet: Runoff
To ensure a gradual decline in the balance sheet, the monthly amounts of securities that were allowed to mature and not be replaced were capped, and amounts above the cap would be reinvested and left on the balance sheet.
- The caps started at $6 billion per month for Treasuries and $4 billion per month for agency debt and mortgage-backed securities.
- The caps increased by those amounts each quarter until they reached $30 billion per month and $20 billion per month, respectively.
In March 2019, the FOMC announced that the cap on Treasuries running off the Fed’s balance sheet would be reduced: from $30 billion per month to $15 billion per month, beginning in May 2019. The FOMC also announced its intention to end the reduction of its securities holdings in September 2019. The end date is not set in stone, however. As stated in the Federal Reserve Board’s July 2019 Monetary Policy Report: “The Committee [FOMC] is prepared to adjust the details for completing balance sheet normalization in light of economic and financial developments, consistent with its congressionally mandated objectives of maximum employment and price stability.”
Editor’s note: On July 31, 2019, the FOMC announced that it would end the runoff of the Fed’s balance sheet earlier than previously indicated.
What runoff looks like
The figures below, which are from the Board’s Monetary Policy Report, show the monthly cap (red line), the amount of “runoff” for the securities (darker blue bars) and the amount reinvested (lighter blue bars) from October 2017 through February 2020. Projected amounts begin in June 2019.
Principal Payments on System Open Market Account Securities
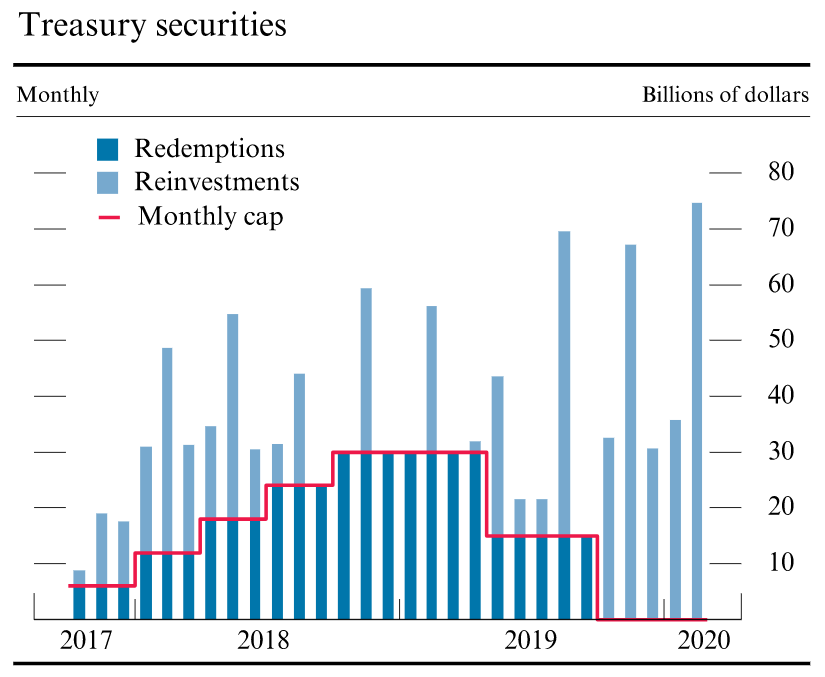
NOTES: Reinvestment and redemption amounts of Treasury securities are projections starting in June 2019. The data extend through February 2020.
SOURCE: Monetary Policy Report: July 2019, Board of Governors of the Federal Reserve System.
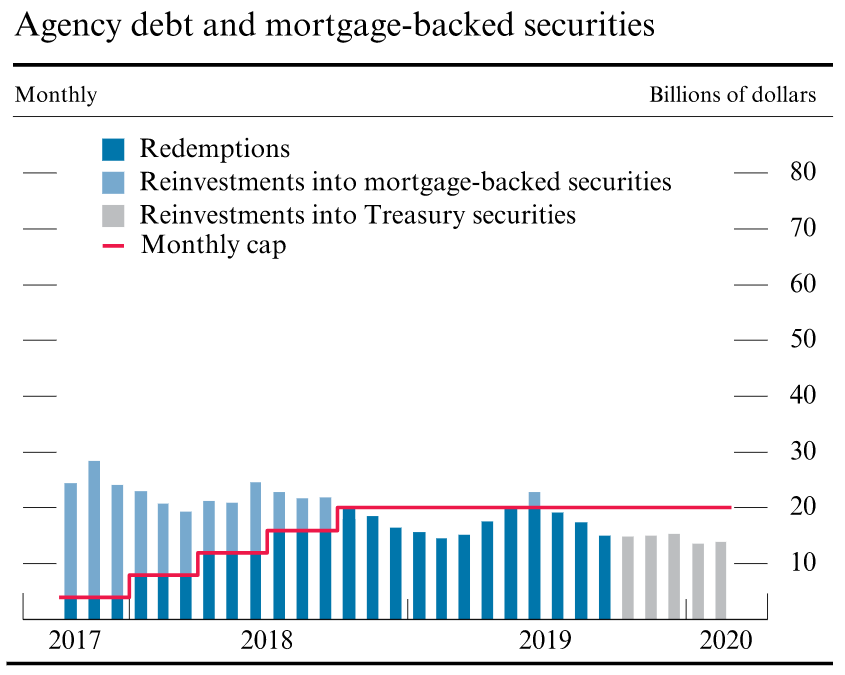
NOTES: Reinvestment and redemption amounts of agency debt and mortgage-backed securities are projections starting in June 2019. Starting in October 2019, principal payments from holdings of agency securities below $20 billion per month are reinvested into Treasury securities, while those above are reinvested into agency mortgage-backed securities. The data extend through February 2020.
SOURCE: Monetary Policy Report: July 2019, Board of Governors of the Federal Reserve System.
The figure above also includes gray bars, which are related to the FOMC’s intention to hold mostly Treasuries in the longer run. As noted in the March 2019 announcement, principal payments from agency debt and mortgage-backed securities will go toward purchases of Treasuries, up to $20 billion per month, beginning in October 2019. Amounts above that will go toward purchases of mortgage-backed securities.
The Fed’s Current Balance Sheet
So, what does the Fed’s balance sheet look like today?
The FRED graph below gives us a look at total assets held by the Fed as well as its holdings of Treasury securities and mortgage-backed securities.
- The total amount of Treasury securities has declined by about $370 billion since the end of September 2017.
- The total amount of mortgage-backed securities has declined by about $235 billion over that same period.
Effects of Quantitative Tightening
Turning to the effects of QT, if QE was intended to help ease financial conditions and stimulate the economy, does QT do the opposite?
Two St. Louis Fed analyses from earlier this year may provide some insights.
1) In an April 2019 essay, St. Louis Fed Vice President Christopher Neely discussed the impact of QE and forward guidance. He wrote: “Studies indicate that from 2008-13 the Fed’s asset purchases and forward guidance about future short rates jointly reduced 10-year Treasury yields by 100 to 200 basis points on impact and that this reduction modestly raised overall prices and real activity.”
However, Neely said, quantitative tightening “is unlikely to significantly impede economic activity.”
He explained that “most of the yield reductions from Fed unconventional policies are probably already undone; some will not be reversed (i.e., yield changes from the reintroduction of liquidity in bond markets); and the remaining effects will probably disappear gradually, over the course of many years. As a result, quantitative tightening will probably not affect the economy in any noticeable way.”
2) In a March 2019 blog post, St. Louis Fed President Jim Bullard argued that the financial and macroeconomic effects of QE and QT may be asymmetric. “That is, the size of the balance sheet may have mattered while it was increasing but not while it has been decreasing,” he said.
This argument is based on the idea that quantitative easing provided a valuable signal when the policy rate was near zero, Bullard explained.
“In that situation, the FOMC may wish to signal convincingly that it will keep the policy rate near zero ‘for longer’—that is, beyond the time that an ordinary approach to monetary policy would call for rising rates. QE may have been a good approach to accomplish this objective, which is why it had important effects,” he said.
However, the situation was different once the policy rate was no longer near zero. “Now, with the policy rate well above zero, any signaling effects from balance sheet changes have dissipated,” Bullard said.
“This means that balance sheet shrinkage, or QT, does not have equal and opposite effects from QE,” he wrote, adding, “Indeed, one may view the effects of unwinding the balance sheet as relatively minor.”
Notes and References
1 From late 2011 to the end of 2012, the FOMC also used a maturity extension program (often called “Operation Twist”), which involved selling or redeeming shorter-term Treasury securities and purchasing longer-term Treasury securities. The purpose of this program was also to reduce longer-term interest rates.
2 During the three QE programs, the Fed purchased the following types of securities:
- QE1: agency debt (direct obligations of Fannie Mae, Freddie Mac and the Federal Home Loan Banks), mortgage-backed securities and longer-term Treasuries
- QE2: longer-term Treasuries
- QE3: mortgage-backed securities and longer-term Treasuries
Additional Resources

This blog explains everyday economics and the Fed, while also spotlighting St. Louis Fed people and programs. Views expressed are not necessarily those of the St. Louis Fed or Federal Reserve System.
Email Us