


How Well Are Inflation Expectations Anchored? Two Datasets Compared
Since January 2012, the Federal Reserve has held a long-run inflation target of 2%. Policymakers consider price expectations to be “well anchored” when inflation outlooks roughly match this 2% target. To examine how well U.S. inflation expectations are anchored, a 2023 article by Kristoph Naggert, Robert W. Rich and Joseph TracySee Kristoph Naggert, Robert W. Rich and Joseph Tracy’s 2023 article, “The Anchoring of U.S. Inflation Expectations since 2012,” in the Federal Reserve Bank of Cleveland’s Economic Commentary. compared data from the Federal Reserve Bank of Philadelphia’s Survey of Professional Forecasters (SPF)The SPF is a collection of responses from a set of individuals on a range of macroeconomic indicators. This blog post considers only the portion of the SPF related to inflation expectations. against the Fed’s 2% target.
In their article, Naggert, Rich and Tracy define the degree of inflation anchoring at a particular time, t, as the sum of squared differences between each SPF respondent’s expectation of future inflation, , and the Fed’s target. The sum below represents the average deviation of individual expectations from the 2% goal. An increased (decreased) level of this degree represents poorly anchored (well-anchored) inflation expectations.
Naggert, Rich and Tracy break this degree into components, providing insight into inflation anchoring. The first component in the equation below provides a measure of the difference between the average respondent expectation, , and the 2% target. We refer to this expression as the “bias component.” The second component, the “disagreement component,” is equal to the average deviation between each respondent and the consensus forecast. The decomposed equation, therefore, provides an understanding of how far inflation expectations have drifted from the target and the degree to which respondents disagree on future price changes.
In their article, Naggert, Rich and Tracy found that during their sample period, the first quarter of 2007 to the first quarter of 2023, the disagreement component largely drove movements in the total degree of anchoring at the five-year/five-year-forward horizon and when inflation expectations were well anchored at the five-year horizon. In contrast, during the uptick in prices after the onset of the COVID-19 pandemic, the bias component primarily drove poorly anchored expectations at the five-year horizon.
To expand their findings, this blog post compares Naggert, Rich and Tracy’s results to those using the same equations they developed but with another set of data: the University of Michigan’s Surveys of Consumers. Part of our analysis replicates figures from their original commentary, adding more-recent data.
Inflation Anchoring in SPF Data
In this section, we present figures originally produced by Naggert, Rich and Tracy but with data extended to the third quarter of 2025. The first figure below shows the anchoring components we discussed above at the five-year horizon. The anchoring degree (orange line) soared in 2022, hitting a high of nearly 2 percentage points squared. After this disruption, expectations became nearly perfectly anchored to the Fed’s inflation target in the third quarter of 2024, at just 0.06 percentage points squared. Five-year-ahead expectations have since settled at 0.21 percentage points squared, just around the sample average of 0.25 percentage points squared. While expectations have become better anchored, the bias component (dashed blue line) still contributes substantially to the total degree of anchoring; before the COVID-19 pandemic, however, the disagreement component (dashed green line) made up most of the total degree of anchoring. At the end of the sample, the bias component made up 64% of the total degree of anchoring.
Inflation Anchoring: SPF 5-Year Horizon, 2007:Q1-2025:Q3
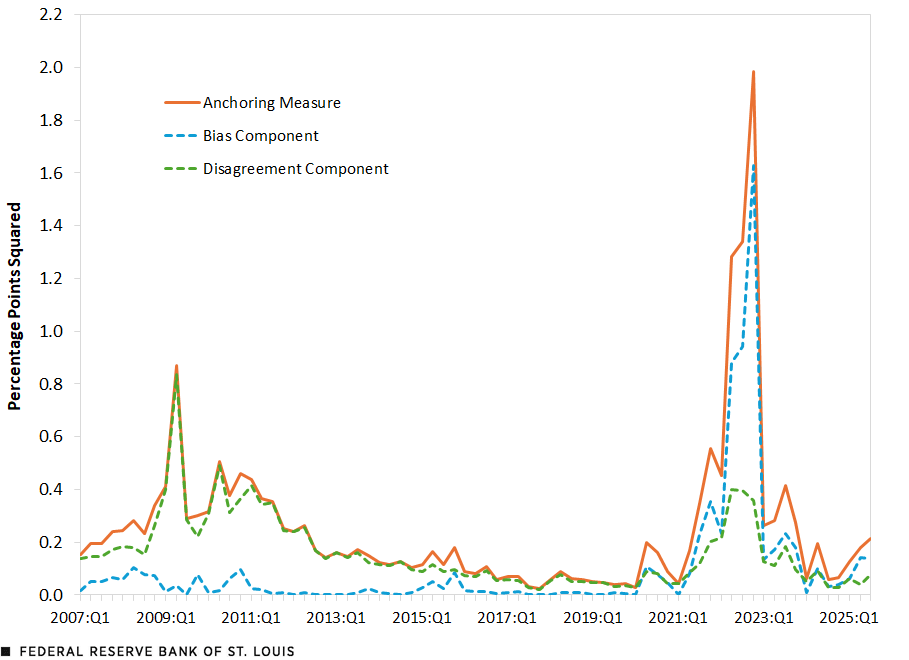
SOURCES: Naggert, Rich and Tracy (2023), SPF and authors’ calculations.
Since Naggert, Rich and Tracy’s article in 2023, total anchoring at the long-term horizon, shown in the next figure, has not changed drastically. Since the first quarter of 2023, the degree of anchoring has fallen slightly, from 0.15 percentage points squared to 0.13 percentage points squared. Naturally, long-term anchoring tends to be more stable than its medium-run counterpart. The makeup of total anchoring also remains stable throughout the sample. The disagreement components account for 92% of total anchoring in the third quarter of 2025; the average over the sample is 88%.
Inflation Anchoring: SPF 5-Year/5-Year-Forward Horizon, 2007:Q1-2025:Q3
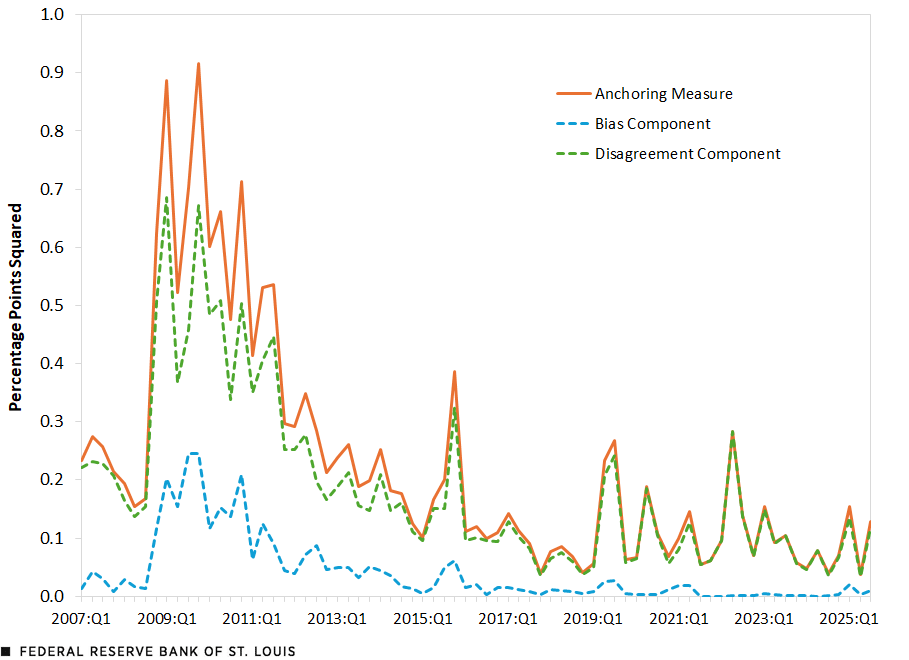
SOURCES: Naggert, Rich and Tracy (2023), SPF and authors’ calculations.
Inflation Anchoring in University of Michigan Surveys of Consumers Data
The University of Michigan’s Surveys of Consumers span nearly five decades (January 1978 to August 2025 at the time of this analysis), allowing for comparison across multiple inflationary periods in U.S. history.We omit any responses below -50% or above 50% inflation. Below are the inflation anchoring measures for one-year-ahead inflation expectations. The figure shows two obvious durations of poorly anchored inflation expectations: the Great Inflation of the 1970s to early 1980s and the period during and following the COVID-19 pandemic. For the Great Inflation period, both components seem to contribute equally to the inflation unanchoring. For the rest of the sample, however, disagreement between forecasts largely drives the total degree of anchoring. On average, the disagreement component makes up 67% of the total anchoring.
Inflation Anchoring: University of Michigan Surveys of Consumers 1-Year Horizon,
January 1978-August 2025
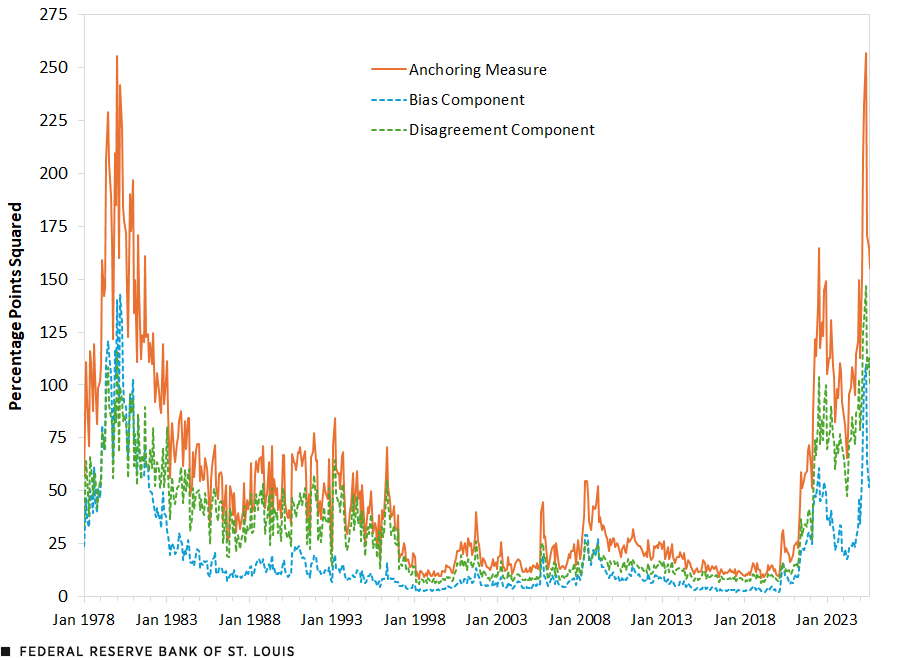
SOURCES: Naggert, Rich and Tracy (2023), University of Michigan Surveys of Consumers and authors’ calculations.
To more easily see patterns in the recent episode, the following figure restricts dates from the figure above to 2007 and after. At the highest degree of unanchored expectations, May 2025, disagreement between forecasts made up 57% of the total degree of anchoring. Total anchoring also peaks in July 2022 at 165 percentage points, and the disagreement component makes up 63% of that figure.
Inflation Anchoring: University of Michigan Surveys of Consumers 1-Year Horizon,
January 2007-August 2025
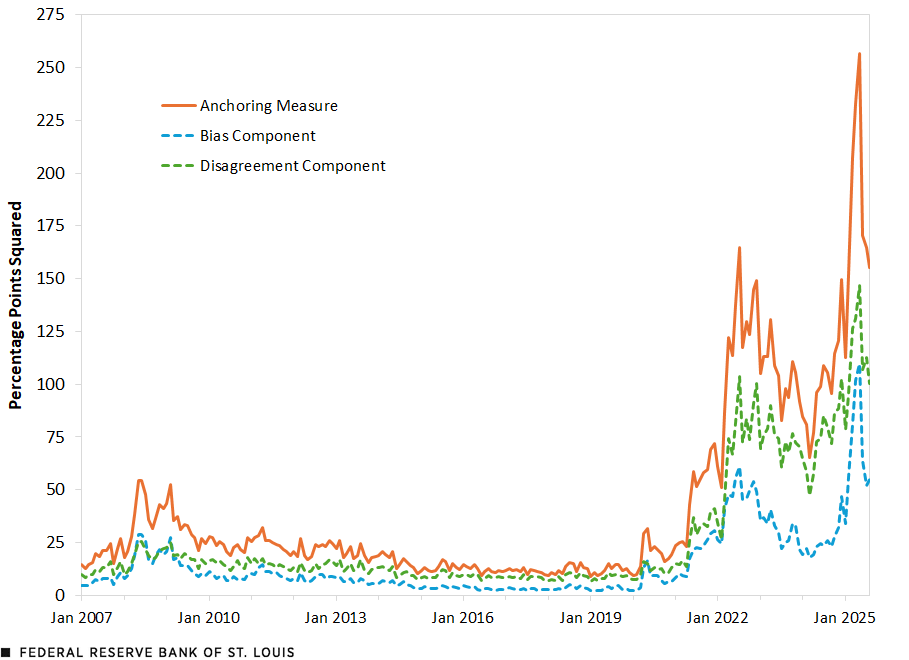
SOURCES: Naggert, Rich and Tracy (2023), University of Michigan Surveys of Consumers and authors’ calculations.
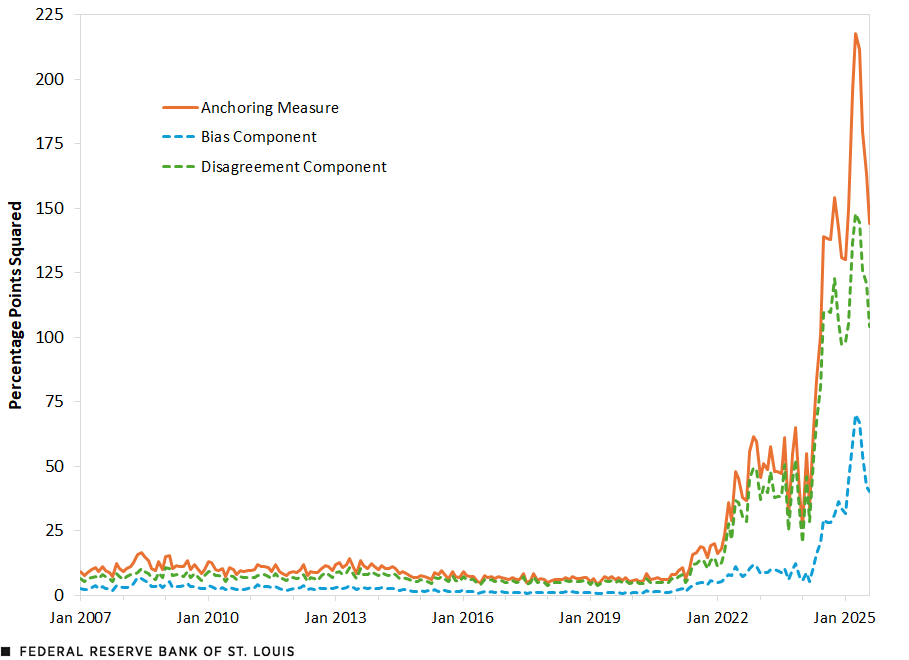
The figure below presents the anchoring components at a five-year horizon using the University of Michigan survey. Because of large amounts of missing data, this figure is also limited to dates in 2007 and after. Surprisingly, this longer-run counterpart to the University of Michigan survey’s one-year-ahead inflation expectations does not show significantly improved anchoring, especially most recently. Total anchoring stood at 144 percentage points squared in August of this year, while anchoring at the one-year horizon stood at 155 percentage points squared.
Inflation Anchoring: University of Michigan Surveys of Consumers 5-Year Horizon,
January 2007-August 2025
SOURCES: Naggert, Rich and Tracy (2023), University of Michigan Surveys of Consumers and authors’ calculations.
Summary
Inflation expectations are an important predictor of future inflation. There are multiple horizons and datasets policymakers can use to study how well inflation outlooks are tethered to the Fed’s 2% goal. Two prominent sources for data on inflation expectations, the SPF and the University of Michigan’s Surveys of Consumers, tell somewhat different stories. At the five-year horizon, both datasets reveal poorly anchored expectations in the summer of 2022. The SPF data, though, show that in recent years, unanchoring over a five-year horizon is largely driven by the bias component. The Surveys of Consumers data, however, show that disagreement between forecasts is a stronger predictor.
Notes
- See Kristoph Naggert, Robert W. Rich and Joseph Tracy’s 2023 article, “The Anchoring of U.S. Inflation Expectations since 2012,” in the Federal Reserve Bank of Cleveland’s Economic Commentary.
- The SPF is a collection of responses from a set of individuals on a range of macroeconomic indicators. This blog post considers only the portion of the SPF related to inflation expectations.
- We omit any responses below -50% or above 50% inflation.


Citation
Michael W. McCracken and Anna Cole, ldquoHow Well Are Inflation Expectations Anchored? Two Datasets Compared,rdquo St. Louis Fed On the Economy, Sept. 25, 2025.
This blog offers commentary, analysis and data from our economists and experts. Views expressed are not necessarily those of the St. Louis Fed or Federal Reserve System.
Email Us
All other blog-related questions